Objective
Using click data recorded from website visits, cluster analysis is performed and behavior profiles are created for real-time classification of the current visitor based on click behavior.
The demo is based on click data from visits to the Viscovery website over six months. In the map below, you can see the behavior classes that were identified and how they were interpreted. By clicking any region of the map, you can open the corresponding profile and inspect class characteristics.
Advantages and benefit
The analysis of website use opens multiple and diverse applications. The essence of visitor information in the form of user profiles and click-data clustering allows optimization of websites according to customer needs, delivery of specific target-group profiles to marketing departments, and the use of relevant information for managing subscriber relationships. Real-time classification of probable user behavior can be used for profile-based content guidance as well as for providing individualized advertisements in real-time, ensuring the right reaction at the right time.
This showcase is inaccurate on mobile devices. Please switch to the desktop version.
Click in any cluster to open the corresponding behavior profile.
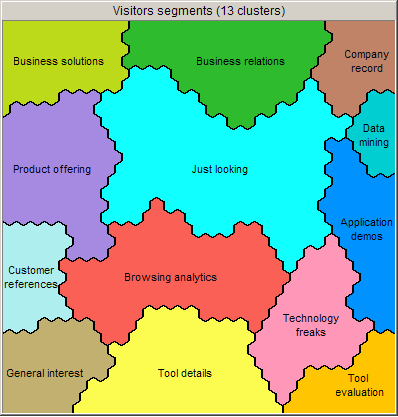
Current cluster (active): Browsing analytics
Behavior profile of active cluster (click to enlarge).
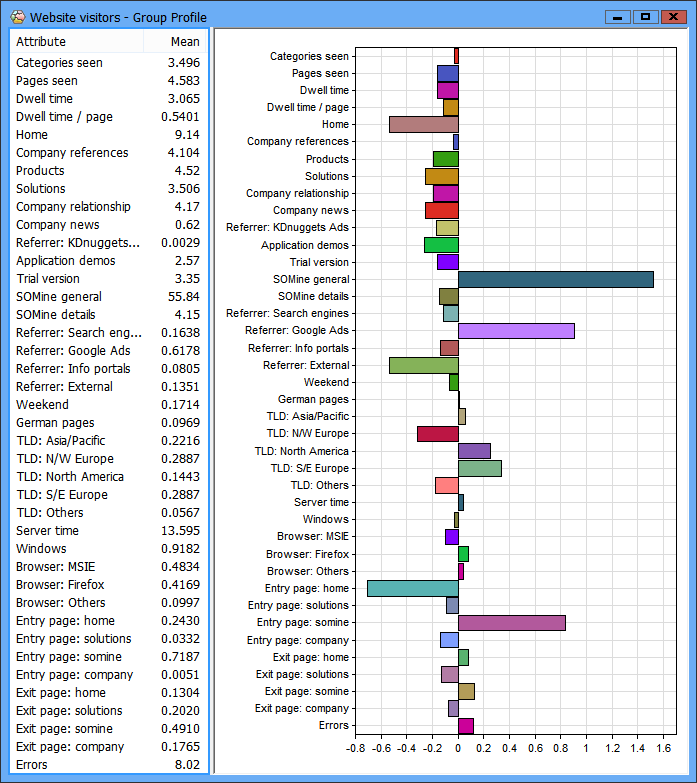
Interpretation of current cluster profile: Would like to get a quick overview of available tools or methods.
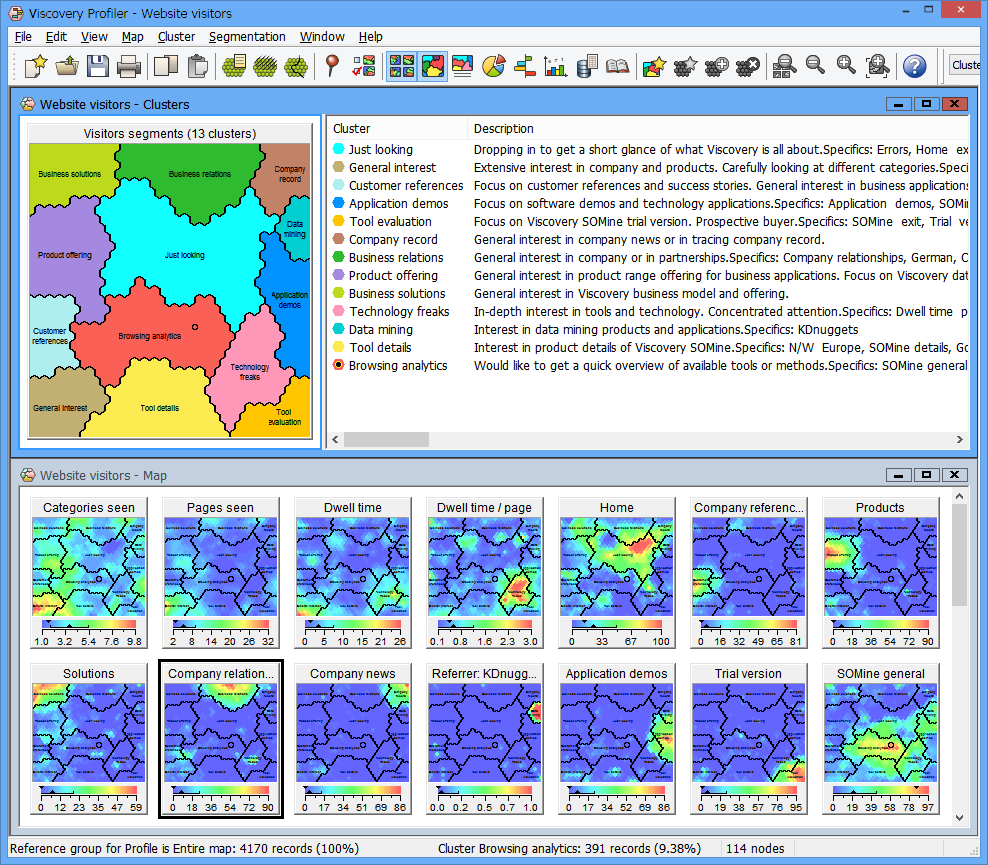 Click the screenshot to view model details.
Data source and acknowledgement
Click data from visits to the Viscovery website were recorded for a six month period. Variables included the time and duration of stay, dwell times for specified categories and subpages, as well as information about the operating system (OS), browser, referrer, and top-level domain (TLD).
No cookie or personal information was retrieved or analyzed. Different visits made by a single visitor were stored as separate records, so each visit resulted in one anonymous profile. Visits from search robots and other irregular visits have been filtered out. The present modeling analysis was performed using 4170 valid records with 24 attributes.
Data preprocessing
Visits containing outliers were discarded (i.e., dwell times <0.2 minutes or >30 minutes, dwell times per page <3 seconds). Values contained in nominal variables (browser, referrer, TLD, exit and entry page) have been grouped in meaningful categories (e.g., the TLD values UK, DE, CH, BE, FR etc., are grouped into the “N/W Europe” category). No transformation was applied to any of the variables.
SOM creation
The self-organizing map was created from the final data set with Viscovery SOMine, using standard settings, "Accurate" training schedule, and reduced "Priorities" between 0.3 and 0.6 for OS and browser specific attributes.
The resulting map comprised 13 clusters of typical usage behavior whose profiles have been interpreted and labeled in the map.