Article

Urban Shape and Built Density Metrics through the Analysis of European Urban Fabrics Using Artificial Intelligence

by
Francisco Javier Abarca-Alvarez
1,2,*,
Francisco Sergio Campos-Sánchez
1,2 and
Fernando Osuna-Pérez
1
1
Department of Urban and Spatial Planning, University of Granada, 18071 Granada, Spain
2
Higher Technical School of Architecture, University of Granada, 18071 Granada, Spain
*
Author to whom correspondence should be addressed.
Sustainability 2019, 11(23), 6622; https://doi.org/10.3390/su11236622
Submission received: 30 September 2019 / Revised: 16 November 2019 / Accepted: 22 November 2019 / Published: 23 November 2019

Abstract

:
In recent decades, the concept of urban density has been considered key to the creation of sustainable urban fabrics. However, when it comes to measuring the built density, a difficulty has been observed in defining valid measurement indicators universally. With the intention of identifying the variables that allow the best characterization of the shape of urban fabrics and of obtaining the metrics of their density, a multi-variable analysis methodology from the field of artificial intelligence is proposed. The main objective of this paper was to evaluate the capacity and interest of such a methodology from standard indicators of the built density, measured at various urban scales, (i) to cluster differentiated urban profiles in a robust way by assessing the results statistically, and (ii) to obtain the metrics that characterize them with an identity. As a case study, this methodology was applied to the state of the art European urban fabrics (N = 117) by simultaneously integrating 13 regular parameters to qualify urban shape and density. It was verified that the profiles obtained were more robust than those based on a limited number of indicators, evidencing that the proposed methodology offers operational opportunities in urban management by allowing the comparison of a fabric with the identified profiles.

Graphical Abstract

1. Introduction

The concept of density is now often considered a key determinant of the sustainability and urban structure of a city [1]. Examples of this can be found in studies on energy consumption in transport, such as through the correlation low density and dependence on car use [2,3,4,5,6], showing the reduction in efficiency in the Urban Sprawl [5], or controlling residential density in transit-oriented development [7]. It has been described how low density generates homogeneity and social segregation [8], the decline of communities [9], with hostility, especially in the lives of women and single parents [10], and, in short, a decline of the city [11]. It has also been described that an increase in land use occupation contributes to the reduction of urban biodiversity [12]. It has been proved that the influence that typologies and urban morphology have on the energy consumption of the city [13] affecting even their microclimate [13,14,15,16]. The density of use also influences the dwelling price [16,17]. Jabareen has stated that it is now widely accepted that the compactness of the built environment allows for more sustainable urban forms [18]. Churchman described the key role of high density as an aim of urban planning. The author analyzed the potential advantages and disadvantages of high density. To this end, he compiled references and specific actions by evaluating their approach and impact in terms of environmental quality, the improvement of transport systems, the improvement of physical infrastructure and urban shape, and in terms of social and economic factors [19]. This type of research highlights the importance of measuring the built density, using appropriate metrics. As has been shown, density is a key factor, especially due to its influence on the sustainability, vitality, and quality of life of urban fabrics.
Looking at the concept of density in-depth reveals that it is a complex concept, used by multiple disciplines, and that it changes depending on the territory and country [19]. Some authors have differentiated between density itself (relation between the physical space and the population that inhabits it), perceived density (individual perception of the number of people in a place), and crowding (negative perception or stress that accompanies density) [20]. Among such dimensions, there is often a connection, such as the one found between housing densities, named net dwelling density, population density, and the floor area ratio as a measure of building intensity [20].
Considering that each discipline has its own definitions of the concept of density, this paper opts for a focus on the indicators commonly used in urban planning. This approach is no less problematic and lacking in agreement in its definition [19], and especially in the way it is measured [21], even to the present day [22,23], remaining a subject of full relevance in current urban planning [16,24,25].
Some authors, and especially Meta Berghauser Pont [26,27,28,29,30], have contextualized the role of density measurement, management, and control in the definition of cities. This relevance of density is observed from the antique height limitation of the buildings of the congested Roma of Emperor Augustus in the first century BC [31], to the definitions that have founded the contemporary concept of built density. Among the latter, it is worth highlighting the limitation of the occupation of the plot introduced in 1860 by Cerdá in the Eixample of Barcelona [32]; the limitation of 75 inhabitants per hectare of the Howard Garden City proposals of 1898 [33], the maximum density of 30 dwellings per hectare in Unwin’s 1909 proposal [34], management through a parameter equivalent to Floor Space Index in the Reform Building Ordinance of Berlin in 1925 [35], and through the control of spaciousness in Hoenig in 1928 [29]. The built density was also used since the 1950s to manage compensation strategies to favor the generation of the wished form and complexity, as in the case of New York. Its tool named “bonus” [36] was applied to the floor area ratio, which managed to encourage the rise of public spaces and businesses in privately owned areas.
A more complex approach soon became necessary. This was achieved by introducing multiple variables analyzed simultaneously. Walter Gropius in 1930 related building height, solar angle, and land use with built density [37]. Several decades later, Leslie Martin and Lionel March would retake this line of work relating the number of plants, and typology, with the concept named as “constructed potential” [38]. In this way, they connected urban form, in the form of a courtyard, corridor, or pavilion, with the intensity of the resulting construction. Among the most recent studies, it is worth highlighting approaches in which several variables of the urban form are handled simultaneously, placing special value on indicators such as the floor area ratio (FSI), the Ground Space Index (GSI) and network density (N), and analyzing them in an integrated manner [26,27,28,29,30]. Recently, this approach has been updated by reflecting on the works of Martin and March, and incorporating two new variables in the analysis: depth of buildings in plan, and cut-off angles describing the distances by which buildings are separated. Thus, according to its author, a more precise morphological categorization is achieved [39]. Finally, it is worth highlighting certain works in which the identification of urban fabric typologies is proposed, carried out by means of cluster analysis techniques [26,40], sometimes with a multi-scale approach at the level of buildings, blocks and streets [40], and in others focused on a unique scale and the exclusive use of the variables FSI, GSI, and N [26]. None of them statistically evaluate the meaning of each of the proposed clusters. In the second work [26] the convenience of incorporating other complementary variables to quantify density is not evaluated either. This issue is discussed in this paper. To this end, other methodological alternatives are evaluated that allow the integration of a greater number of variables that provide the identification of clusters or profiles in a more robust manner.
Despite the relevance of the concept of built density, as it has been described that when it comes to evaluating or measuring built density, there is no agreement on the most appropriate variables in its definition. Specifically, it should be noted that in the state of art there are certain knowledge gaps: (1) the lack of using statistical clustering methods (e.g., [29,38]); (2) the lack of including a broad spectrum of variables in clustering analysis (e.g., [26]), which could compromise the robustness; and (3) the lack of integrating various scale levels, no one has thus combined the fabric and island scale in one clustering analysis (Berghauser Pont et al. start at the neighborhood scale and then scales up to a 5 km buffer [26]).
With a focus on addressing such knowledge gaps, the main aim of this study was to evaluate the capacity and interest of a methodology based on artificial intelligence techniques, specifically the self-organizing map (SOM) (1) to cluster and identify robustly differentiated urban profiles, interpreting the results statistically, based on a broad spectrum from classical indicators of built density, applied at various scales (fabric and island scale), and (2) to obtain metrics that characterize each such profile with identity. In order to identify the variables that allow the best characterization of urban fabrics, along with their density metrics, we used the Spacematrix’s density indicators and case studies [29,30], from which we implemented artificial intelligence methodologies [41], facilitating the simultaneous and holistic integration of all the variables considered.
The paper is structured as follows: Section 2 describes the sources of information and procedures carried out on them. Section 3 reports the results achieved and the different patterns and profiles of density found in the assessment of the urban fabric are described and characterized; Section 4 gives the main contributions of the work in relation to the state of the art. Finally, the main conclusions are highlighted in the last section.

2. Materials and Methods

2.1. Materials

As a case study on which to validate the proposed methodology, the parameters of the built density described in the documentary based on European urban fabrics provided by Berghauser Pont and Haupt in Spacematrix [29,30] were used. These authors developed an investigation with aims relatively similar to ours, providing 117 cases of European urban fabrics located in the Netherlands, Germany (Berlin), and Spain (Barcelona). In our study, we uniquely analyzed the urban form and the built density as measures of physical density, without the aim to use other measures of densities. For this reason, neither the population density (i.e., inhabitants/ha) nor the density of dwellings (i.e., number of dwellings/ha) were incorporated, as these are factors that change relatively easily over time, without the built density necessarily being affected. Our mean contribution is about an existing method to cluster pattern of the built environment, based on Spacematrix and, therefore, the same variables are used on it. For each of these fabrics, the following variables were collected [29]:
- Base Land Area (A): Area of the perimeter that delimits each fabric in study based on its delimitation in the homogeneity and similarity of its forms and in a common origin or planning by means of a project and identity design.
- Floor Space Index (FSI): Relates the total built area and the total floor area of a fabric. It is an abstract index that by itself does not incorporate characteristics of the uses to which it refers. In certain references to this parameter, it is named the floor area ratio (FAR) [20].
- Ground Space Index (GSI): the relationship between the built space and the total fabric area. This is an index of land consumption by the building, also called coverage [20].
- Open Space Index (OSR): the relationship between unbuilt space and total built surface. This is an index that describes the amount of free area corresponding to each unit of building area. Calculated: OSR = (1 − GSI)/FSI.
- Layers (L): Average height of buildings. It is calculated: L = FSI/GSI.
- Network Density (N): Concentration of net on the base land area. It is calculated by adding the interior street length of the fabric studied and half the perimeter street length and dividing it by the total surface area of the fabric. It is a factor that indicates the amount of infrastructure at a location.
- Mesh width (w): Average distance between road axes. Describes how dense the road mesh is. Calculated: w = 2/N.
- Profile width (b). Mesh size: Average width of the road. Calculated: b = 2 [1 − √(1 − T)]/N.
- Tare (T): Relationship between the surface of the road and the total of the base land area (A). It is an index that relates the proportion of public land (roads and open spaces) and private land (inside the urban blocks).
The above nine variables were evaluated by taking into consideration the entire area of the fabric under study, including the road surface that is delimited by its perimeter. In this study and in its sources [29,30], they are called with the prefix “Fabric”. Both studies also incorporated five additional variables that correspond to the previous variables when they are measured without considering the interior road to the perimeter of the fabric. These variables are A, FSI, GSI, and OSR. Following the nomenclature of the authors of the database [29,30], the prefix “Island” was added to these variables.

2.2. Introduction to Artificial Intelligence Methods Used in Research

This research proposes a holistic approach to all the variables involved, seeking coherence between the data. This was carried out by determining patterns between the values of the different variables that represent each urban fabric of the study. In order to determine such patterns, data mining procedures from the artificial intelligence field were implemented. Specifically, an artificial neural network (ANN) was used, understood as a computational model inspired by biological neural networks. The ANN used in this work introduces an unsupervised (not requiring human participation in training) and competitive learning called the self-organizing map (SOM). This is a methodology consisting of an iterative model [42] that presents the peculiarity of generating, as a result, a topological representation (map) in which the objects or entities of study can be represented. In this representation, each item of the survey—in our case, each of the different urban fabrics involved—is represented surrounded by, or near to other urban fabrics, which, after training turn out to be similar. Thus, all the variables are involved in the obtained result, and structures of coherence emerged between the values that were reached for each one of them. SOMs have the quality of generating prototypes of knowledge by discovering patterns and trends in the data [43], a phenomenon that is considered fundamental, and this method has already been used for the discovery of precisely these structures. These topological structures are extremely useful for making comparisons between the entities under analysis, between the profiles obtained, or between the entities and the identity profiles themselves.
The SOM methodology does not require data normalization when the analysis has more than 12 dimensions [44], showing great resilience and robustness to multicollinearity problems [45,46].
SOMs have important advantages over other statistical models that assume the linearity of relationships between variables [47]. Thus, SOMs are more powerful than linear models for analyzing the properties of variables and are of singular interest for their topological representations [48]. The SOM is a data mining technique with a heuristic approach [49], constituting, together with the K-means, the most popular clustering methods [49]. The SOM provides better results than the K-means [50], with the added singularity that through its maps, it evidences the topological relationships and the similarities or differences between the data.
The SOMs originally proposed by Kohonen in 1982 [41] soon had wide acceptance and application in multiple disciplinary fields, proving very useful for the discovery of knowledge in exploratory research [51]. Although, in the early years, they were mainly used in areas related to statistics and information technologies [52], more recently, Kohonen himself opened the SOM methodology to the social sciences field with his seminal work on global welfare and poverty structures [53].
The SOMs have been used in fields close to the discipline of urban and spatial planning in various studies, among which we can highlight the analysis and classification of German cities [54], the representation of temporal dynamics of the city of Harrisburg (USA) [55], the identification of urban sprawl dynamics of Milan (Italy) [56], the classification of demographic regions from census data in Athens [57], the analysis of the residential market from price variables, and residential qualities in Finland, Hungary and the Netherlands [58], the visualization of spatial-temporal patterns of geographical variables in the USA [59], the characterization of neighborhoods based on census information in New York [60], the classification of German communities based on information on population, migration, taxes, residence, employment, and transportation [61], or the obtaining of patterns of urban transformations in European cities [62]. More recently, SOMs have been useful in characterizing historical urban fabric in Santa Fe (Spain) [63], in integrating information on climate, topography, soil, geology, land use and population [64], in obtaining semantic representations of exemplary neighborhoods [65], facilitating the comparison of the level of orientation of several cities towards the transit-oriented development approach [66], in the classification of European climate change adaptation initiatives [67], or in the analysis of opinion surveys on urban environments [68].
The research methodology is based on SOMs, and although it has rarely been used by other research for morphological analysis of urban density, it is a powerful and reputable alternative to traditional statistical techniques [57] which can be used itself to analyze and visualize data [53]. Some authors have rejected or criticized techniques based on ANNs, generally alluding to the black box phenomenon, and for a hypothetical lack of knowledge of what happens inside the ANN [69]. This problem refers to the fact that only the final results are shown and not the process that has been carried out. In our case, we considered that this problem is not such for three fundamental reasons: (1) the algorithm governing the artificial neural network process is perfectly documented; (2) the iterative process can be stopped at any time and the state can be documented; and (3) the validity of the emerging structures can be statistically verified. On the other hand, there is research that attempts to compare ANNs by means of simulation with statistical models of multiple regression, discriminant analysis and logistic regression in prediction and classification, demonstrating a performance of ANNs similar or superior to the other models [70].
Thus, SOMs are raised as a tool that the analyst has at his or her disposal to analyze, represent, and visualize data [71]. SOMs have a number of operational advantages: (1) they are suitable for exploratory analysis [60]; (2) they allow all original variables to be visualized simultaneously [47]; (3) they show much more powerful representations than methods using classical linear analysis [48]; (4) they cluster in a more robust and complete way than traditional descriptive methodologies [72], specifically than K-means [50]; (5) they allow an effective visual exploration and validation of the results [73]; and (6) facilitate a powerful visualization easy to interpret [47], maintaining the topological relationships of the data [48]. The SOM can be used with both quantitative and qualitative variables [68,74,75] and results similar to those achieved with a panel of experts [76] can be obtained, thus allowing for improved results and savings in operating costs in the process.

2.3. Obtaining Metrics Based on Case Studies Using Artificial Intelligence

2.3.1. Obtaining profiles

This phase was based on the creation of a clustering model and knowledge of the data and morphological features of urban fabrics. An ANN was used for this, specifically, the SOM methodology. This methodology, being unsupervised, allows the cluster without attributing any label of definitions and meanings that must be previously attributed. This is a useful methodology to reduce the enormous complexity of the data [60].
The clustering of the urban fabrics in profiles is carried out by means of an additional Ward cluster analysis on the map. Thus, prototypes are generated by modeling patterns and trends in information [43]. The choice of the number of clusters or profiles to be reached has been a much-researched problem, with multiple different methods and criteria [47]. The use of a combination of such methods is common [77]. A distinction can be made between such methods, which presents a statistical approach and uses validation metrics, such as “sums of squares”, or dispersion [78]. These include the Ball and Hall index [79], Calinski and Harabasz [80], the Davies-Bouldin [81], the Silhouette Coefficient [82], the Cubic Clustering Criterion [77], and the method based on the evaluation of dendrograms [77]. In order to decide on the optimal number of clusters, an analysis was performed using multiple indices, up to a total of 27 different indices. For this purpose, the tool constituted by the package “clusterCrit” [83] of the Software R Project for Statistical Computing was used. The results of these indices are interpreted globally, both numerically and graphically, with special consideration given to those indices that obtain the best results in certain studies [84]. Finally, a number of clusters is obtained with which the profiles of urban fabrics are identified and characterized.

2.3.2. Characterization of the profiles: Obtaining the metrics of the density of each profile

To facilitate the understanding of the profiles obtained and thus obtain the metrics that govern it, each cluster was characterized with its basic statistics, such as the mean, standard deviation, maximum and minimum [85], mainly in order to obtain two additional results: (1) the factors or variables that are relevant for the effect and (2) the value or effect size [86]. For the analysis of the profiles, together with the statistical information that defines them, the mono-variable SOM Maps are valuable, allowing to evaluate relationships and correlations between the variables in a graphic and intuitive way. Based on the recommendations made by the American Statistical Association [87], for each variable and profile, together with the statistical significance, its effect size (ES) was calculated [88]. Statistical significance was calculated using the bilateral Student’s t test (p-value ≤ 0.05), which makes it possible to determine whether there is a significant difference between the means of the identified profile and the set of fabrics under study. The effect size and, specifically, the Cohen’s d effect size is a quantitative measure of the magnitude of a phenomenon. In our case, it is a measure of the influence that each variable has on the profile understudy, and it is calculated as the standardized mean difference, i.e., as the difference of the mean between the experimental group (profile) and the mean of the control group (population mean), divided by the standard deviation of the population [88]. In order to facilitate the interpretation of the ES and as a key metric of the relevance of the variables in the definition of each profile, the effect sizes are indicated following Cohen’s criterion [89]. Thus, for each variable involved in the construction of the profile, the ES is shown as follows: +++ large positive effect, ++ medium positive effect, + low positive effect, - low negative effect, - - medium negative effect, - - - large negative effect. Thus, each profile is described together with the centrality values of each variable (mean and standard deviation), by a qualitative and quantitative measure of the relevance of each variable in the definition of such profile. In other words, a metric is obtained that allows the identification of the variables that help to pick out the density represented by the profile, and that should, therefore, be considered in any process of evaluation and reproduction of the density in question. The Viscovery SOMine 5.0.2.t. software (Viscovery Software GmbH, Vienna, Austria) was used for the construction of the SOM (self-organizing maps) model due to its good results at the visual representation level [90].

3. Results

3.1. Classification of Urban Fabrics into Profiles

Following the methodological process described in Section 2, through an iterative process and the evaluation of the results, the clustering was carried out through the SOM. As shown in Figure 1, based on technical criteria for the best interpretation, as it is explained below, a classification into 12 profiles was considered appropriate. This figure shows the Self-Organizing Map in which the identifying code [29,30] of each one of the urban fabrics of the study is marked with a red font, and each one of the 12 identified profiles with a larger font.
Each of the urban fabrics represented in Figure 1 is shown, according to the SOM criteria, together with other similar fabrics, thus presenting the most similar urban fabrics closest to each other and the most different fabrics most distantly from each other.
The next step is the process of clustering the SOM results:
For this analysis, a priori, 14 is chosen as the upper limit considering that greater partitions could make interpretation and relevance difficult in relation to the 117 tissues studied. When observing the best partitions of the 27 best number of clusters, both numerically and graphically (Figure 2), it is observed that there is a certain disparity between them. A significant repetition of the partition of two profiles can be highlighted, confirming that the partition in two profiles tends to be the most frequent in morphological analysis [40].
The statistical data corresponding to the partition in two clusters is shown in Figure 3, labeled as Pattern A and Pattern B. With the intention of obtaining more detailed and enriched information on urban fabrics, it is considered important to carry out clustering in a larger number of 2 clusters. Figure 2a shows the presence of the second maximum in 9 clusters, Figure 2c, minimum in 6, 10 and 13 clusters, Figure 2b shows maximal differences in 9 and especially in 12 clusters. Finally, Figure 2d shows minimal differences in the interval from 9 to 14 clusters. In view of all this, it is considered appropriate to evaluate in deep the interval of optimal clusters between 9 and 13.
To support the decision of the final number of clusters, it is chosen to complement the statistical criteria with other state of the art criteria. Among them, the one proposed by Joseph F. Hair Jr. et al. [91] stands out. It defines an adjusted range with which it is estimated that it will be possible to interpret the clusters. This range is based on manageability and efficiency criteria for communication and interpretation of results. After the first results by means of a practical judgment, based on the common sense of the researcher and on theoretical foundations, the final number is increased or reduced, based on conceptual aspects of the problem in question which are relevant to expert knowledge of the analyst. According to its author, this method usually provides a better solution than those based exclusively on statistical criteria and far removed from the field of the specific study [91]. In view of the foregoing and in view of the descriptive nature of this research, the use of the latter criterion for the definition of the number of profiles is considered perfectly valid, restricting the number of profiles to a conceptual criterion of the problem. Thus, an iterative process is carried out in which the number of profiles grows between 9 and 13, allowing the evaluation of their meaning and relevance for the object of the study. The process ends when it is no longer possible to explain, with the necessary clarity, the meaning of a new profile, or on the contrary, its excessive fragmentation presents little value at a practical and conceptual level in the research. In our case, the process stopped at 12 profiles. In Profile 2, which is described in the Results section, a large number of fabrics from German “Siedlung” neighborhoods abound, presenting a high degree of formal, spatial and even historical coherence. Thus, fragmenting the sample into 13 clusters divides profile 2, segregating the German Siedlungen into different profiles and breaking, in some way, the coherence previously found in such profile. For this reason and on the basis of the best conceptual criteria on the issue in question, the optimal division into 12 profiles of urban fabrics was considered in our case.

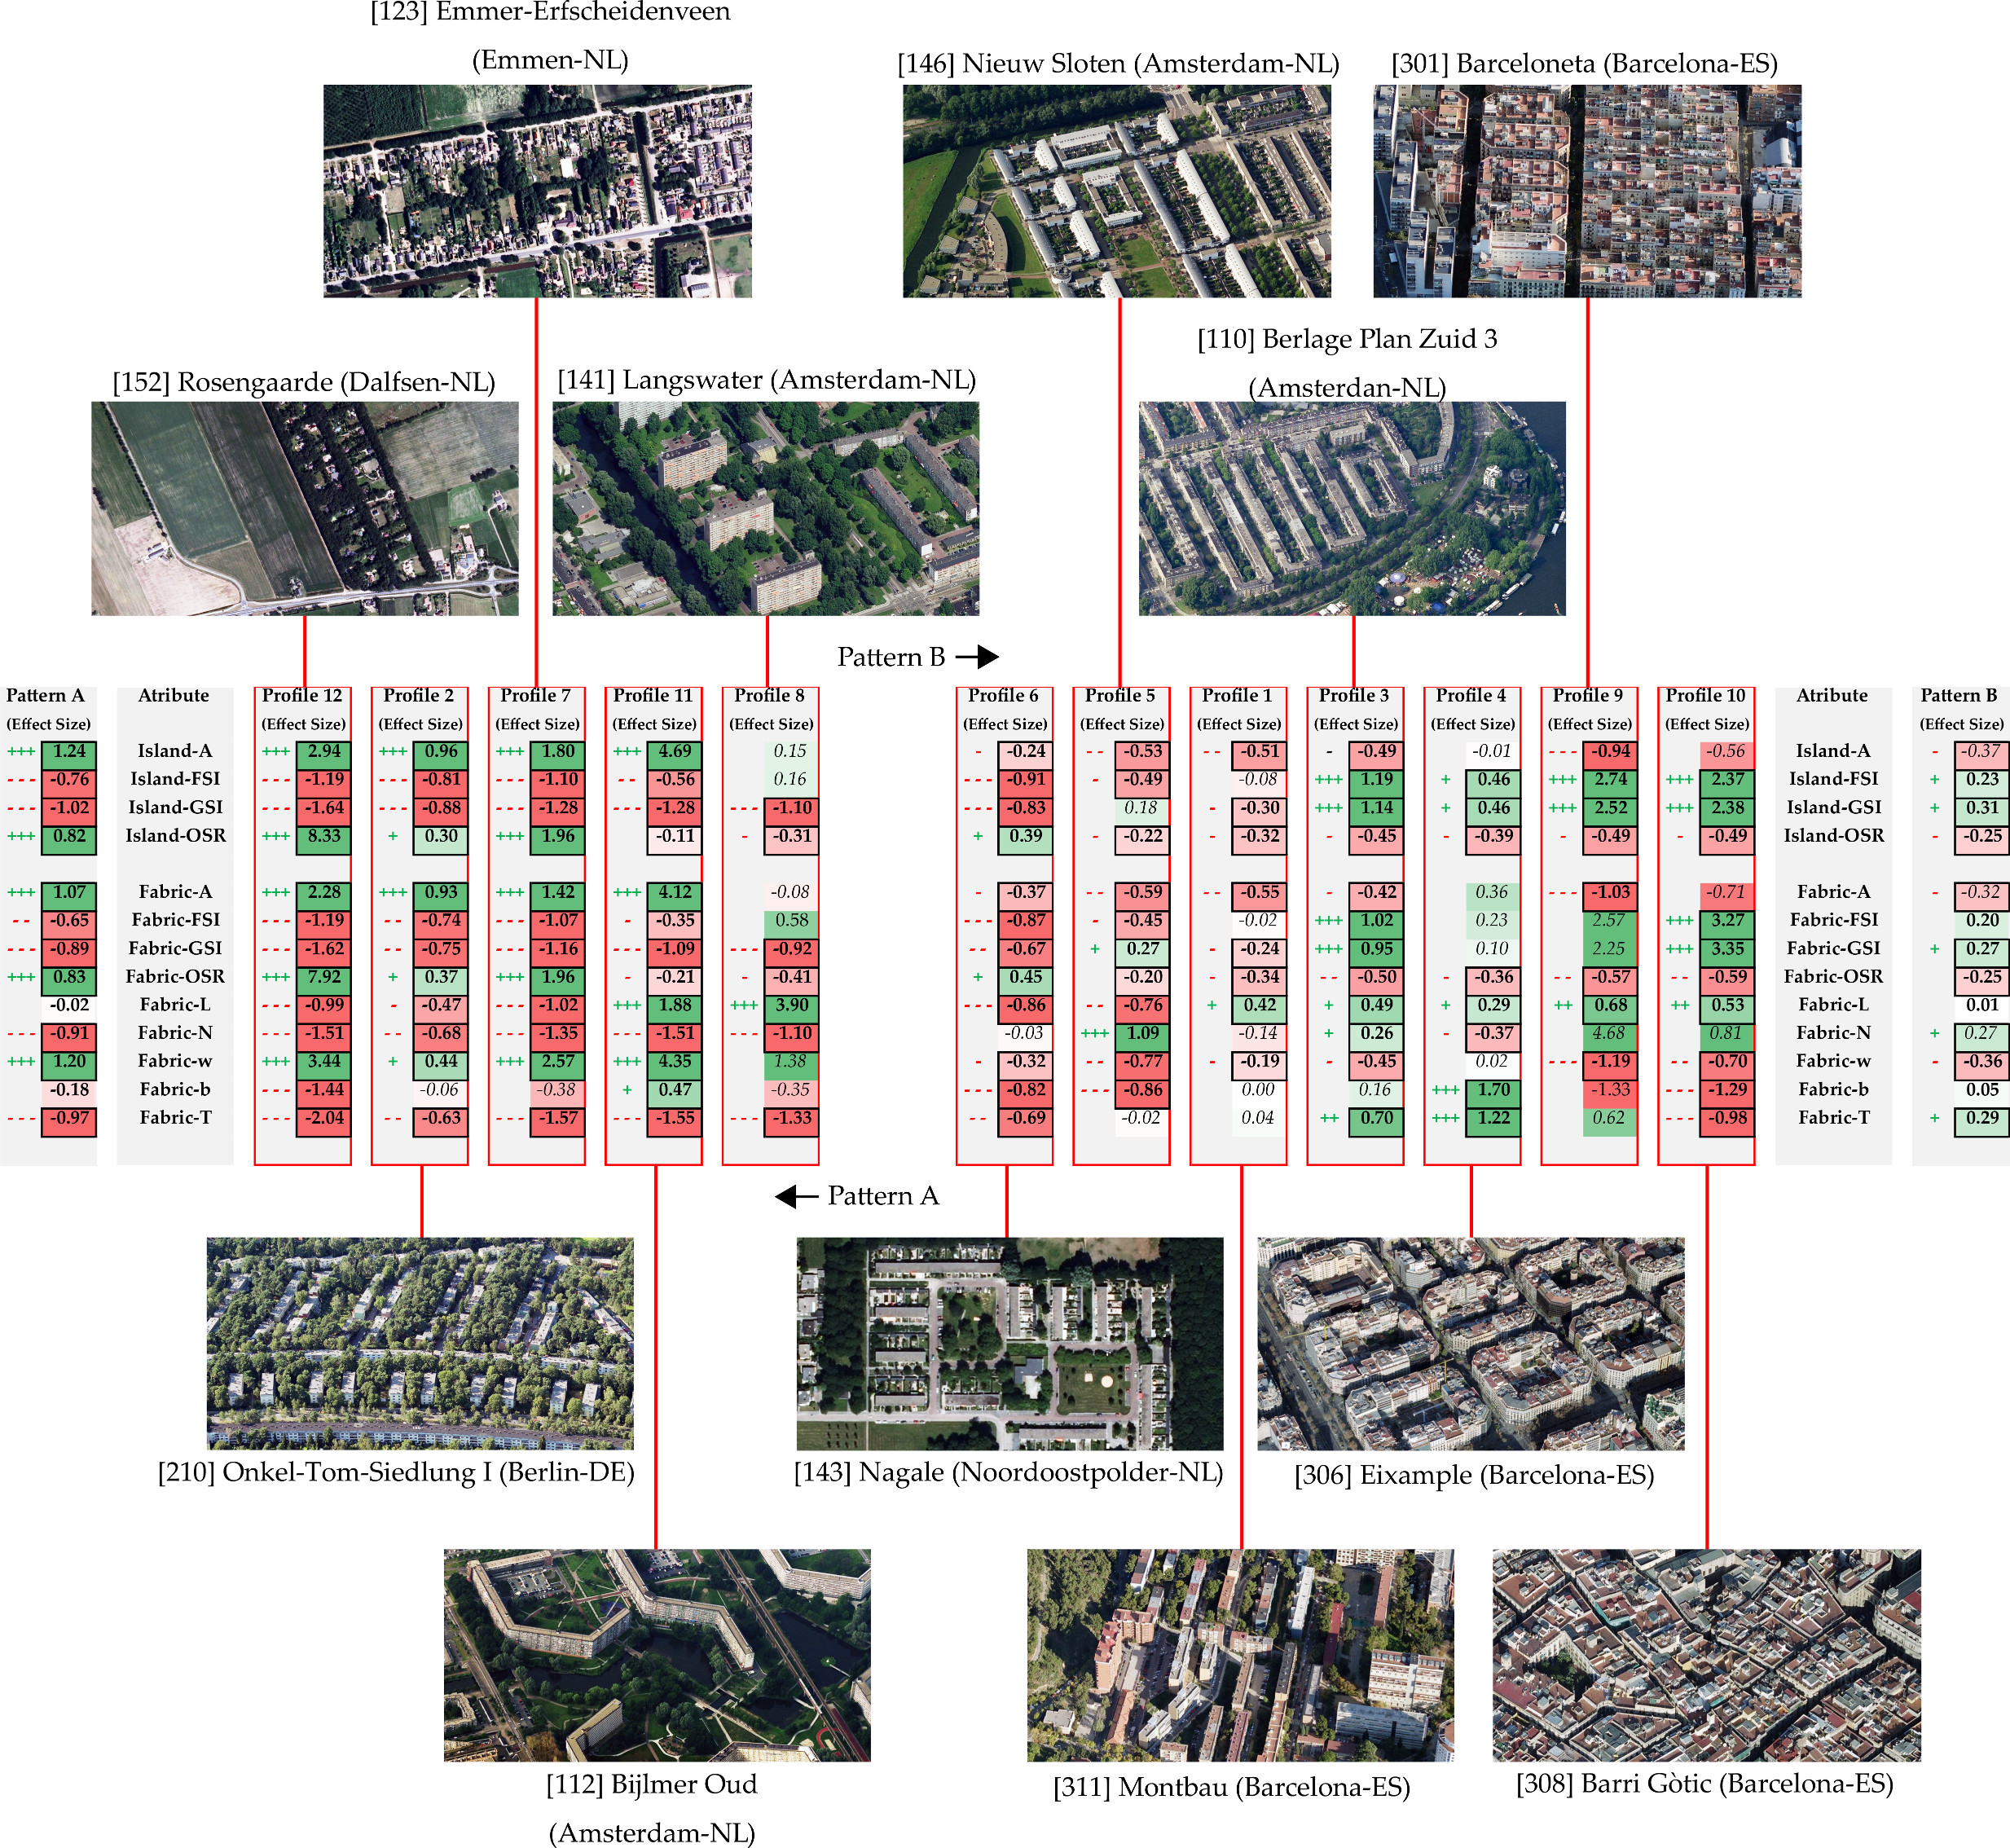
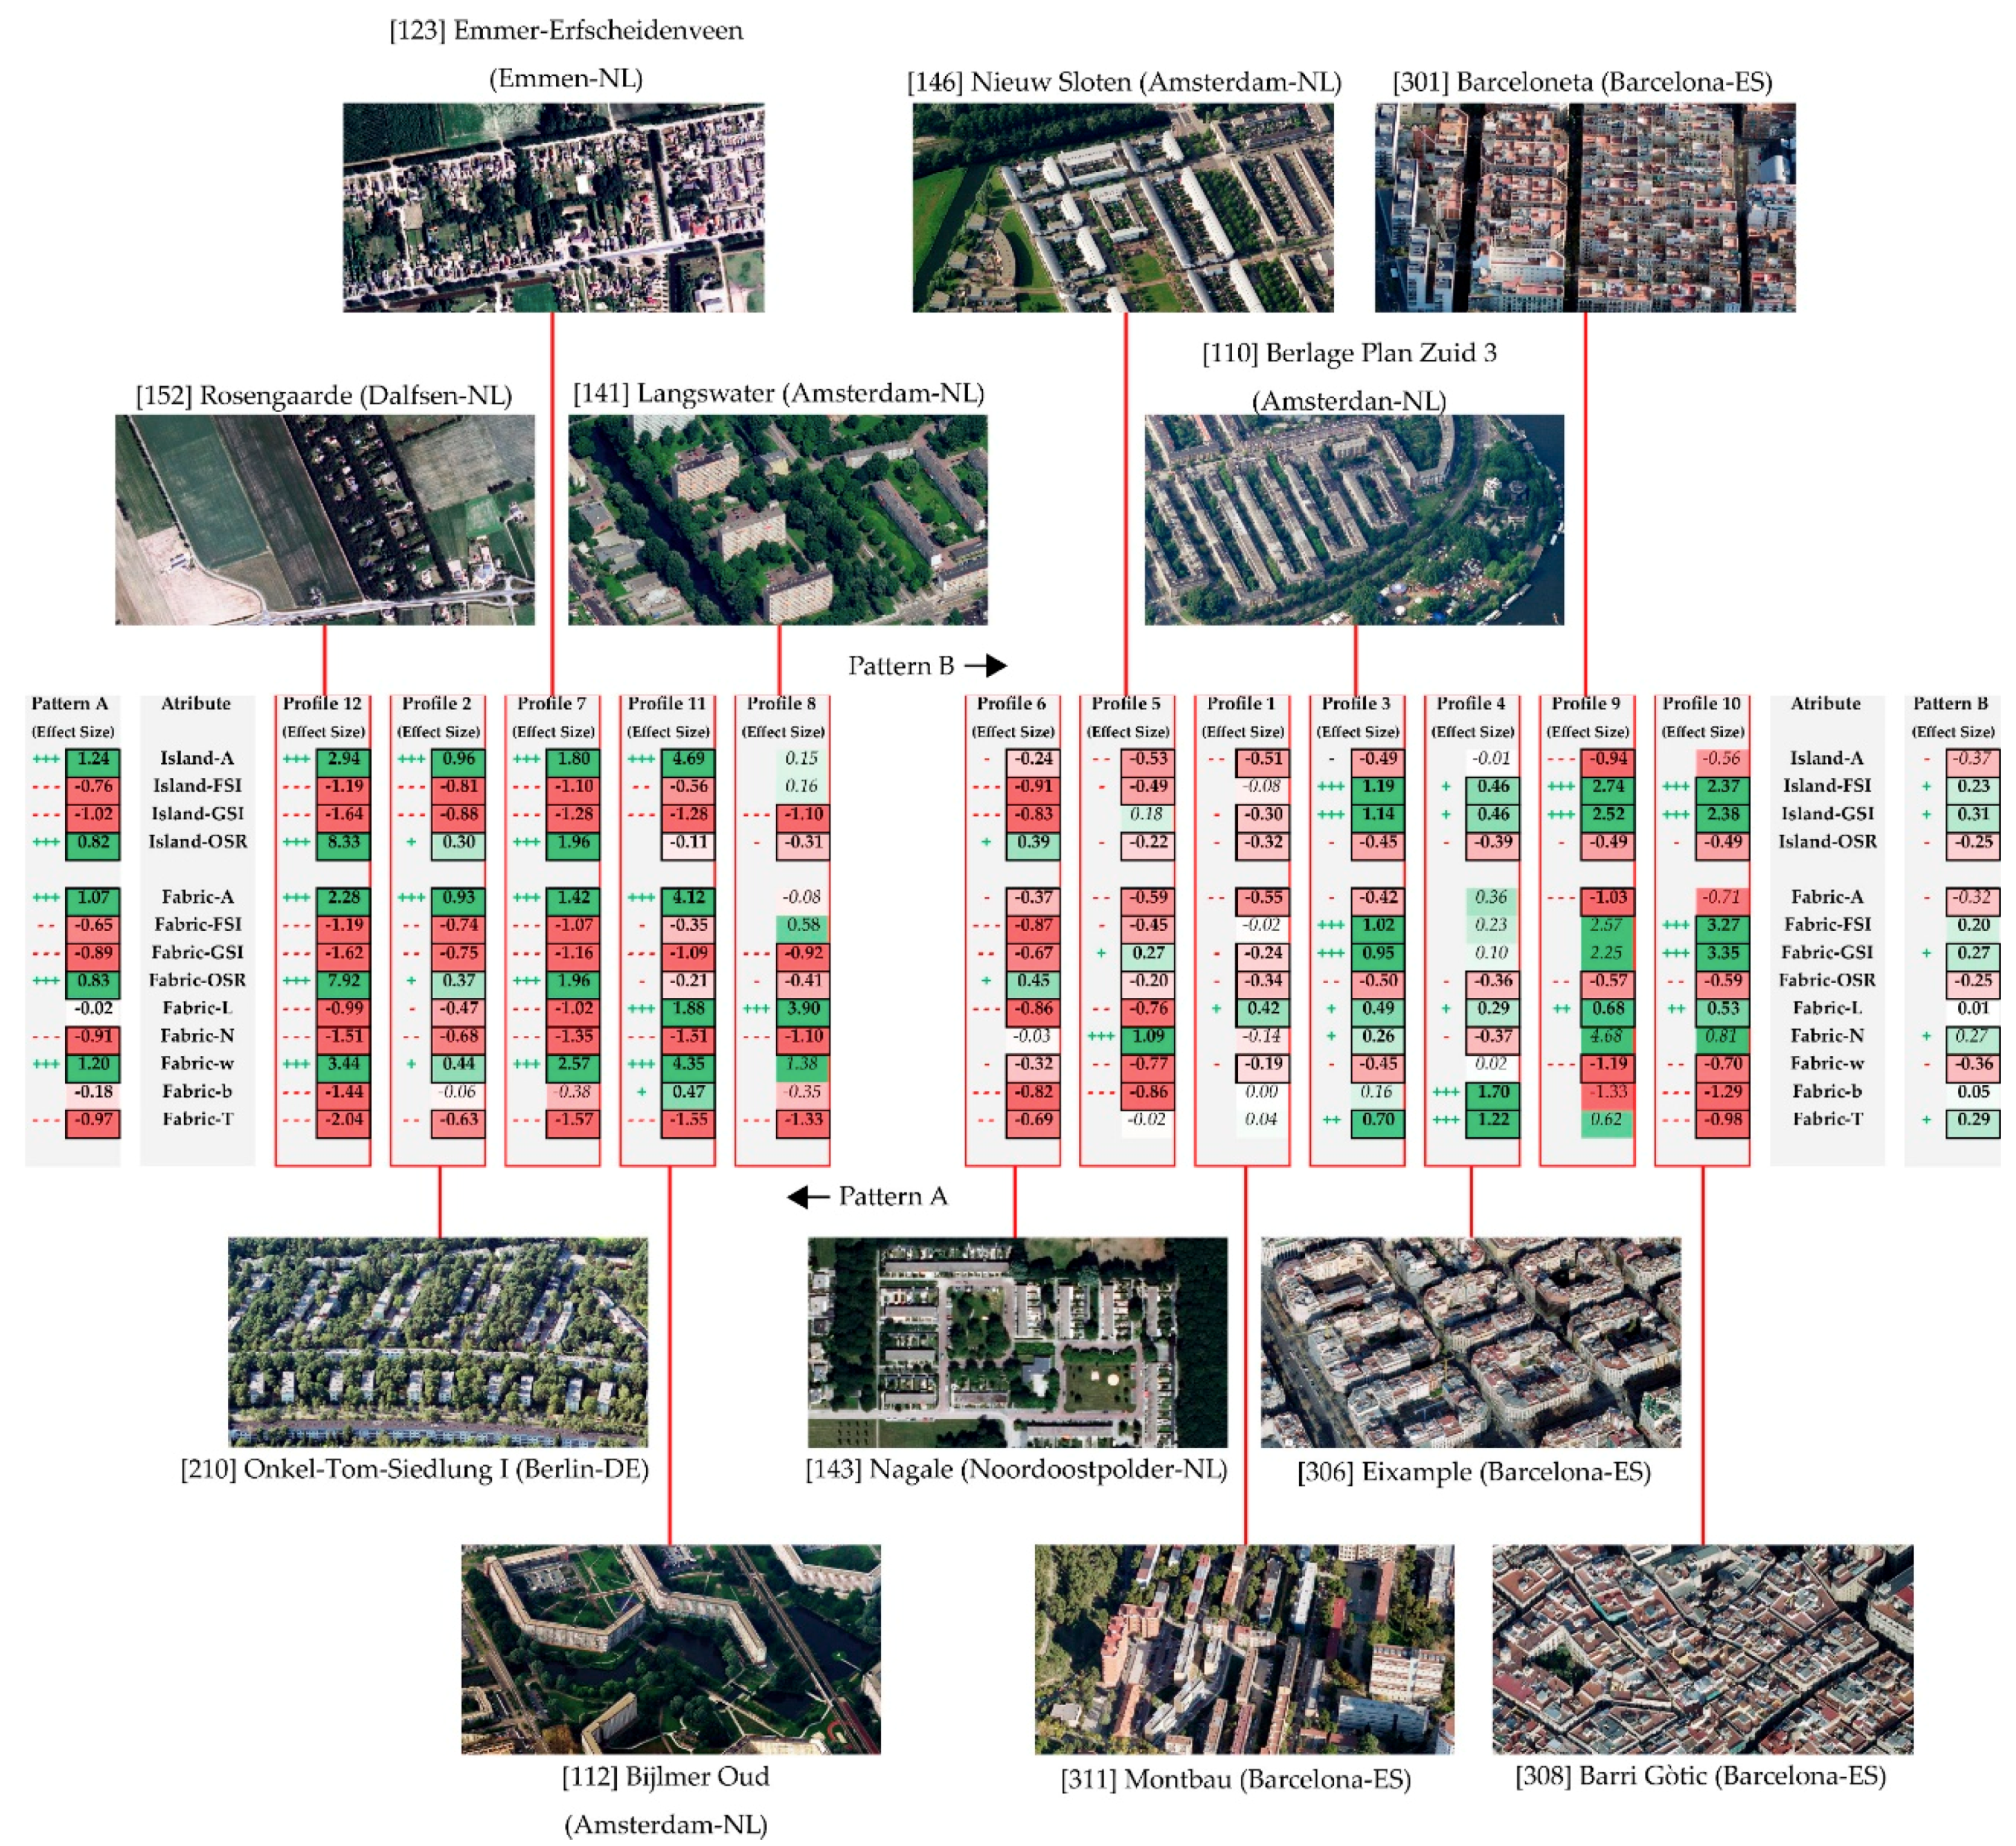
3.2. Characterization and Comparison of Profiles. Built Density Metrics Extraction

The next step according to the methodology consists of characterizing each of the 12 profiles obtained in the previous step. For this purpose, the basic statistical data of the complete sample were compared with those of each profile (Table 1). The means and the standard deviation were compared, providing information on the statistical significance (Student t-test) of such segmentation. Measures of Effect Size (ES) are also provided, which, together with the previous statistical significance, constitute fundamental metrics of the relevance of the variable in the conformation of the profile under study.
Figure 3 is provided as a synthesis of the density metrics of each of the 12 neighborhood profiles obtained. It represents the Effect Size (ES) that each of the 13 variables has in the constitution of each of the 12 profiles. The ES is indicated both qualitatively and quantitatively, marked in bold type and with thick black squares when the influence is statistically significant (according to Table 1). The figure is completed with an aerial photograph of one of the urban fabrics contained in each profile as a sample of the type of density it represents.
The following are the main findings, characterization, and metrics of each type of density obtained from the characteristics of each profile synthesized in Figure 3:
  • Density Montbau Type [311] from Barcelona and similar fabrics: It presents metrics similar to the average of the totality of the fabrics. There are direct proportional relationships between FSI and GSI, between N and T, and an inverse relationship between w and T. This type of density also stands out in relation to other densities close to a relatively low OSR index, while GSI rises slightly, although it remains below the global average L, on the other hand, is significantly above average. Other neighborhoods studied that correspond to Montbau Type Density include Wildermanbuurt [170] (Amsterdam), Besos [302] (Barcelona), Rauchstrasse [213] (Berlin), Borrell I Solier [303] (Barcelona), Buurt Negen [115] (Amsterdam) and Troelstralaan [159] (Amsterdam). As for the spatial forms implied by this type of density, it can be said that its public space is largely reserved for car, although spaces for pedestrians can be observed of a certain quality and with signs of continuity in the network; there exists, although almost anecdotally, a slight typological variability in the neighborhood. The arrangement of slab buildings responds fundamentally to criteria of control of the sun and a certain interest in spatial formalization by means of their volumetric contours.
  • Density Type Onkel-Tom-Siedlungen [210] from Berlin and similar fabrics: A moderately high w, and a moderately low FSI, GSI and L are observed. It also stands out in the different fabrics that the increase of FSI is accompanied by an increase of w. In summary, a moderate but generalized and proportional decrease of all the traditional density indicators is observed with an important increase of A. Other neighborhoods studied that correspond to the Onkel-Tom-Siedlungen Type Density include Siemensstadt [216] (Berlin), Hufeisensiedlung -Britz- [205] (Berlin), De Berg Zuid [117] (Amersfoort), Ijlst [134] (Wymbritseradeel), Staaken [217] (Berlin), Molenaarsgraaf [142] (Graafstrom) and Wageningen-Hoog [166] (Wageningen). The urban morphology of this density that has, among its specimens, several Siedlungen, is well known and has a remarkably high proportion of collective spaces, a relatively low amount of road and a relative typological variability, which generates interesting modes of interaction between the collective and the private spaces. Most of the configuration was developed through blocks of multi-family dwellings of open configuration and row layout, sometimes accompanying the road. In these Siedlungen, as in most of them, there is a relevant confluence between architectural values and the urban organization of the whole, that is to say, the position occupied by each building was perfectly studied for the elevation of certain urban goals, such as, for example, the enhancement of perspective, spatial containment or the control of the scale of collective space.
  • Density Type Berlage Plan Zuid 3 [110] from Amsterdam and similar fabrics: Highlights by a high FSI and GSI, with a relatively low w. It also highlights the fact that when GSI increases, this does not necessarily lead to an increase in GSI. This is explained by the understanding that the FSI is usually increased by an increase in the number of floors, without necessarily transforming the footprint occupied by the buildings. The T is relatively high. Other neighborhoods studied that correspond to the Density Type Berlage Plan Zuid 3 are Vaillantlaan [160] (The Hague), Congres [305] (Barcelona), Gracia [309] (Barcelona), Java Island [135] (Amsterdam), Knsm Island [137] (Amsterdam) and Weena [169] (Rotterdam). The morphology that configures this density revolves around the idea of multi-family block buildings generally arranged around a pedestrian courtyard for collective use.
  • Density Type Eixample from Barcelona [306] and similar fabrics: Highlights the important size of the road and a low correlation between L and the resulting FSI. This denotes interventions through additions to the original structure, probably increasing the constructed footprint or GSI of buildings over time. Other neighborhoods studied that correspond to this density: Zuidwest Kwadrant [177] (Amsterdam), Watergraafsmeer 2 [168] (Amsterdam), Venserpolder [161] (Amsterdam), Vila Olimpica [315] (Barcelona), Peperklip [151] (Rotterdam), Berlage Plan Zuid 1 [108] (Amsterdam), Karl-Marx-Allee 2 [206] (Berlin) and Grachtengordel [127] (Amsterdam). This urban morphology is configured by means of multi-family block buildings arranged around a pedestrian courtyard and generally for collective use. The difference with the previous density type of Berlage Plan Zuid, lies in that in the Eixample from Barcelona, we can find an FSI and a lower GSI, a higher W and consequently, a lower N, although the final computation of the proportion of road over the total is very similar. We could conclude that one of the main differences between the two densities is the greater distance between roads in the Eixample from Barcelona, although it is compensated for, in some way, with a greater width of the latter.
  • Density Type Nieuw Sloten [146] from Amsterdam and similar fabrics: It emphasizes the importance of the road, presenting more interwoven (N), but smaller width (b) and reaching a lower percentage of road (T). There is also a relatively low Height of Buildings (L). Other neighborhoods studied that correspond to the Density Type Nieuw Sloten are Huisduinen [133] (Den Helder), Amsteldorp 1 [102] (Amsterdam), Stevensweert [158] (Maasgouw), Vreewijk [165] (Rotterdam), Colijnsplaat [116] (Noord-Beveland) and Amsteldorp 2 [103] (Amsterdam). The urban morphology is greatly influenced by the configuration of the terraced single-family buildings with the formation of private courtyards inside the block.
  • Nagale Type Density [143] from Noordoostpolder and similar fabrics: Moderately low but generalized and proportional intensity indicators are observed. A and w are slightly lower than the average of all fabrics. Other neighborhoods studied that correspond to Nagale Type Density are Niehove [144] (Groningen) and Wolveschans [172] (Leek). The resulting urban morphology is relatively similar to the previous Density (Nieuw Sloten), although there is a very important difference in the amount of public space. In Nagele is superior, reducing the GSI and resulting in FSI. There is also a clear influence of a greater w in Nagele and simultaneously, the N descends, denoting collective spaces of great importance.
  • Density Type Emmer-Erfscheidenveen [123] from Emmen and similar fabrics: Low-intensity indicators stand out, all with balanced levels with respect to the medium type fabric. It also produces a very high A, OSR, and w. On the other hand, there is a correlation that can be expressed as follows: lower A, imply higher L, i.e., the smaller the plot, the higher the height. Other neighborhoods studied that correspond to the Density Type Emmer-Erfscheidenveen are Hoog Soeren [132] (Apeldoorn) and Staphorst [157] (Staphorst). The urban form undergoes a very important transformation in this typical density as the urban intensity is reduced considerably. The characteristic typology consists of the detached single-family house with large gardens, most of which are of a private nature.
  • Density Type Langswater [141] from Amsterdam and similar fabrics: They stand out for a high L, a low index of T and GSI, and FSI slightly below the reference average. Other neighborhoods studied that correspond to Langswater Type Density are Märkisches Viertel [209] (Berlin) and Berlage Plan Zuid 2 [109] (Amsterdam). The configuration of this type of density revolves around a block typology of high-rise multi-family dwellings without heterogeneity, which denotes a scarce typological and urban variability, probably leading to a certain social homogeneity.
  • Density Barceloneta Type [301] from Barcelona and similar fabrics: It stands out for a high GSI and also a high Island-FSI, which are compensated with the wide road space, obtaining more contained data when referring to the fabric as a whole. The Ribera neighborhood [314] (Barcelona) corresponds to Barceloneta density. The morphology of this type of density is clearly marked by an extremely scarce public space and extremely high FSI. Curiously, most of the little space not occupied by buildings is occupied by roads, totally nullifying any possibility of socialization of public space.
  • Gothic Quarter Type Density [308] from Barcelona and similar fabrics: It stands out on one hand for its high FSI and GSI, and on the other hand, for its low OSR, low w, reduced b, and low T. All of them are indicators of great intensity. Another neighborhood studied that corresponds to the Gothic Quarter Type Density is the neighborhood of Ciutat Vella [304] (Barcelona). The urban form differs from the previous typical density of the Barceloneta with a greater width of mesh and a consequent reduction in the percentage of road over the total land, which irremediably causes an improvement in public space. This can be observed by a certain sponging thanks to the appearance of a good number of places. Curiously, most of the indicators are similar to those of Barceloneta, although, as it is easy to see, the urban result is very different. Here, it was verified that a single indicator greatly transforms the resulting urban configuration.
  • Density Type Bijlmer Oud [112] from Amsterdam and similar fabrics: It stands out for the exiguous and very limited road structure (N, T, and w), and for a high increase of L, but containing the FSI, up to a few levels below the average by means of a low GSI. Bijlmer Oud’s morphology is undoubtedly due to his extreme configuration. It hardly resembles any other of the neighborhoods studied. It stands out enormously for the very scarce amount of road and the great distance that it is necessary to cross until finding another axis of rolled accessibility. This results in enormous amounts of land destined for the collective. This issue has probably led to the well-known social problems of this unique proposal.
  • Density Rosengaarde Type [152] from Dalfsen and similar fabrics: All indicators point to very low density and urban intensity. The morphology of Rosengaarde and Bijlmer Oud are clearly different from the rest of the urban fabrics analyzed. There is no doubt that this is a very low density; all parameters indicate this, leading to an equally low degree of urbanity and capacity for social interaction.
One of the main findings of the study is the setting of profiles and robust metrics that allows the characterization and definition of each of the different types of urban fabrics obtained, allowing us to conclude that each profile has its own metrics, and specifically, each profile has certain variables that are more suitable for definition and consequently, to assess the density built.

4. Discussion

At the conceptual level, and in relation to the case studies evaluated in the paper, this paper establishes a link with the research from which it obtains its main source of information [29,30]. One of the aim of Bearghauser Pont and Haupt’s studies is the search and characterization of the concept of density from the least possible number of parameters, with the intention of being applied to all types of urban fabrics. In these studies, she exposes that such variables provide the sufficient and necessary information about the fabrics and the urban form that it tries to qualify.
Once the results of our research were obtained, the suitability of Berghauser Pont and Haupt’s previous approach of a few universally valid indicators was questioned. Then, based on the case studies in our study, various assumptions were tested in which robustness was assessed to measure the built density:
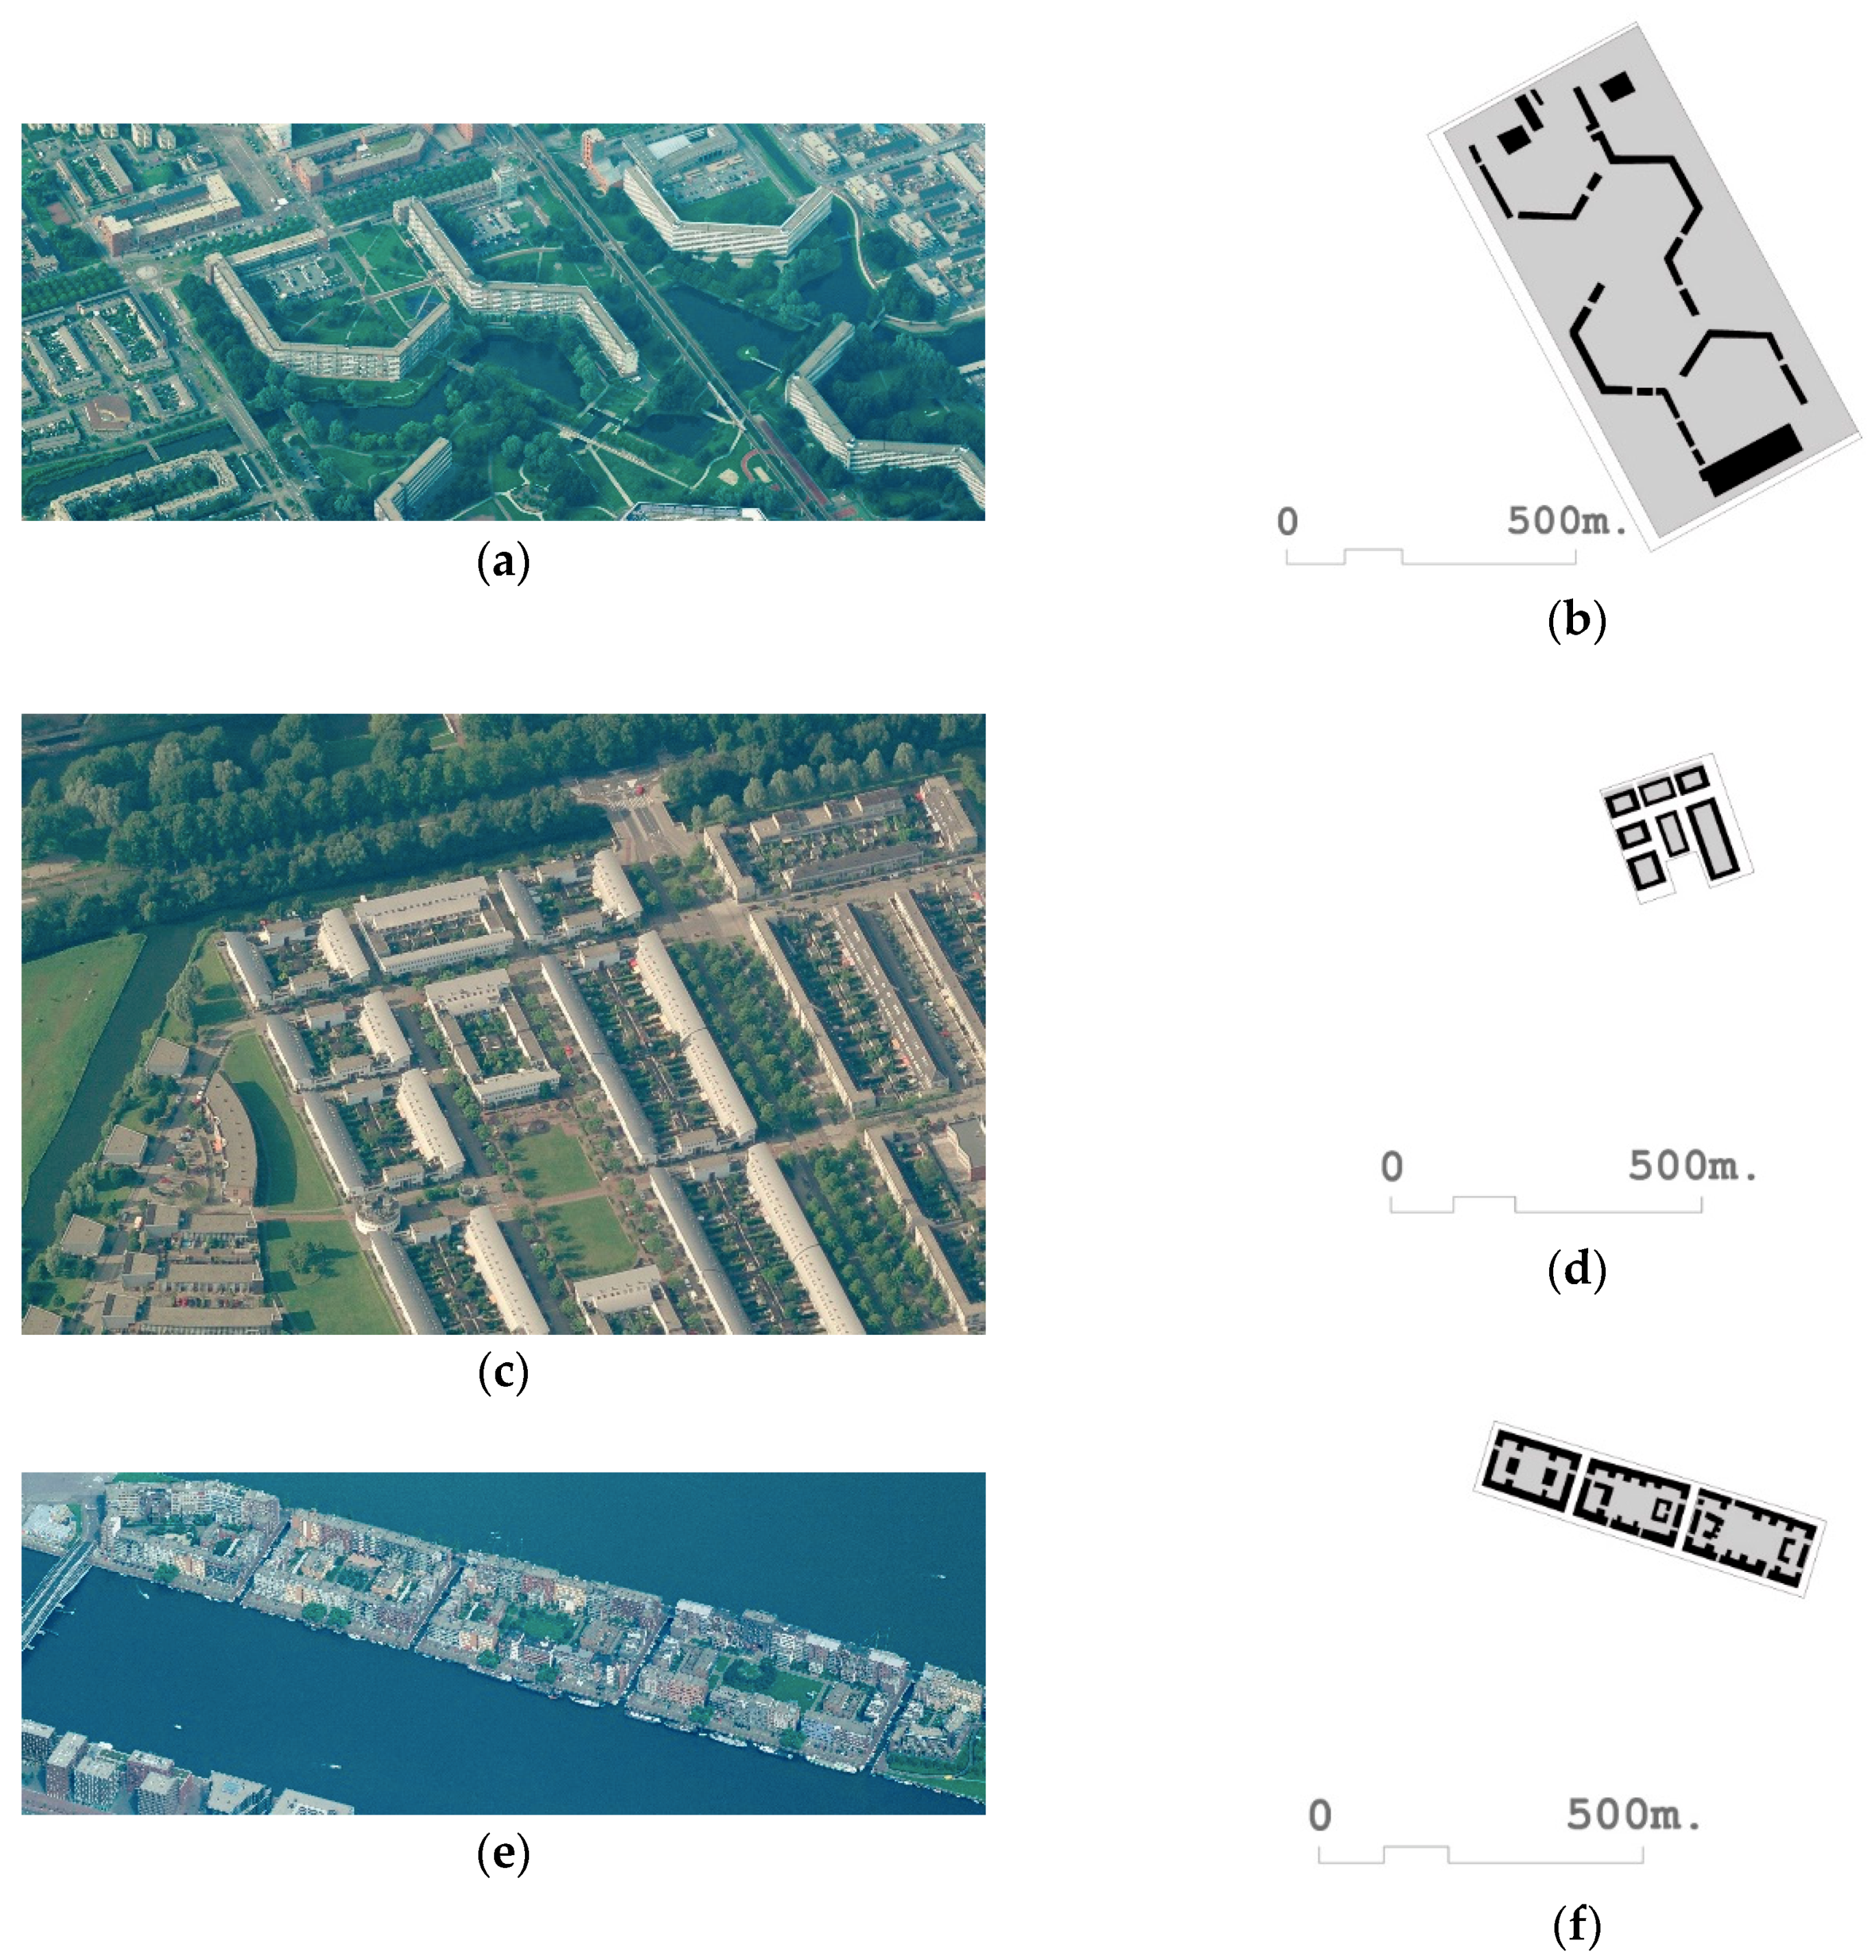
  • In contemporary urban and spatial planning, multiple attempts have been made to define the urban form on the basis of one or two fundamental parameters, mainly through the use of the FSI variable and in a secondary and complementary manner with the GSI variable. It can be verified that the use of these parameters or variables sometimes produces an acceptable approach to the knowledge of urban forms and forms of urbanity, but in certain cases, it can be verified that they are not sufficient or adequate for that purpose. This insufficiency can be seen, for example, when comparing the fabric of [112] Bijlmer Oud and the fabric of [146] Nieuw Sloten, both in Amsterdam. Table 2 shows that Bijlmer Oud has a Fabric-FSI of 0.76 and [146] Nieuw Sloten of 0.77, which are, therefore, very similar. At the same time, they present very different urban forms, as can be verified in Figure 4. It is thus verified that the use of only one variable such as FSI is insufficient to define and qualify an urban fabric. This confirms the earlier work by Berghauser Pont and Haupt [29].
  • If on the other hand, we take, from the same Table and Figure, the urban fabrics [146] Nieuw Stolen and [135] Java Island, also in Amsterdam; we can see that the GSI of both are very similar, 0.33 for the first and 0.34 for the second, but on the other hand, the second has an FSI of almost triple that the first (0.77 vs. 2.09). It is also observed that the GSI parameter in isolation does not provide enough information to determine or transmit the main characteristics of fabrics and their forms of urbanity, and can rather lead to misunderstandings if the parameters are handled in isolation. It is clear that an approach to density from a single parameter, such as FSI or GSI, is ill-advised to understand the intensities and urban forms that accompany them. This also confirms the earlier work by Berghauser Pont and Haupt [29].
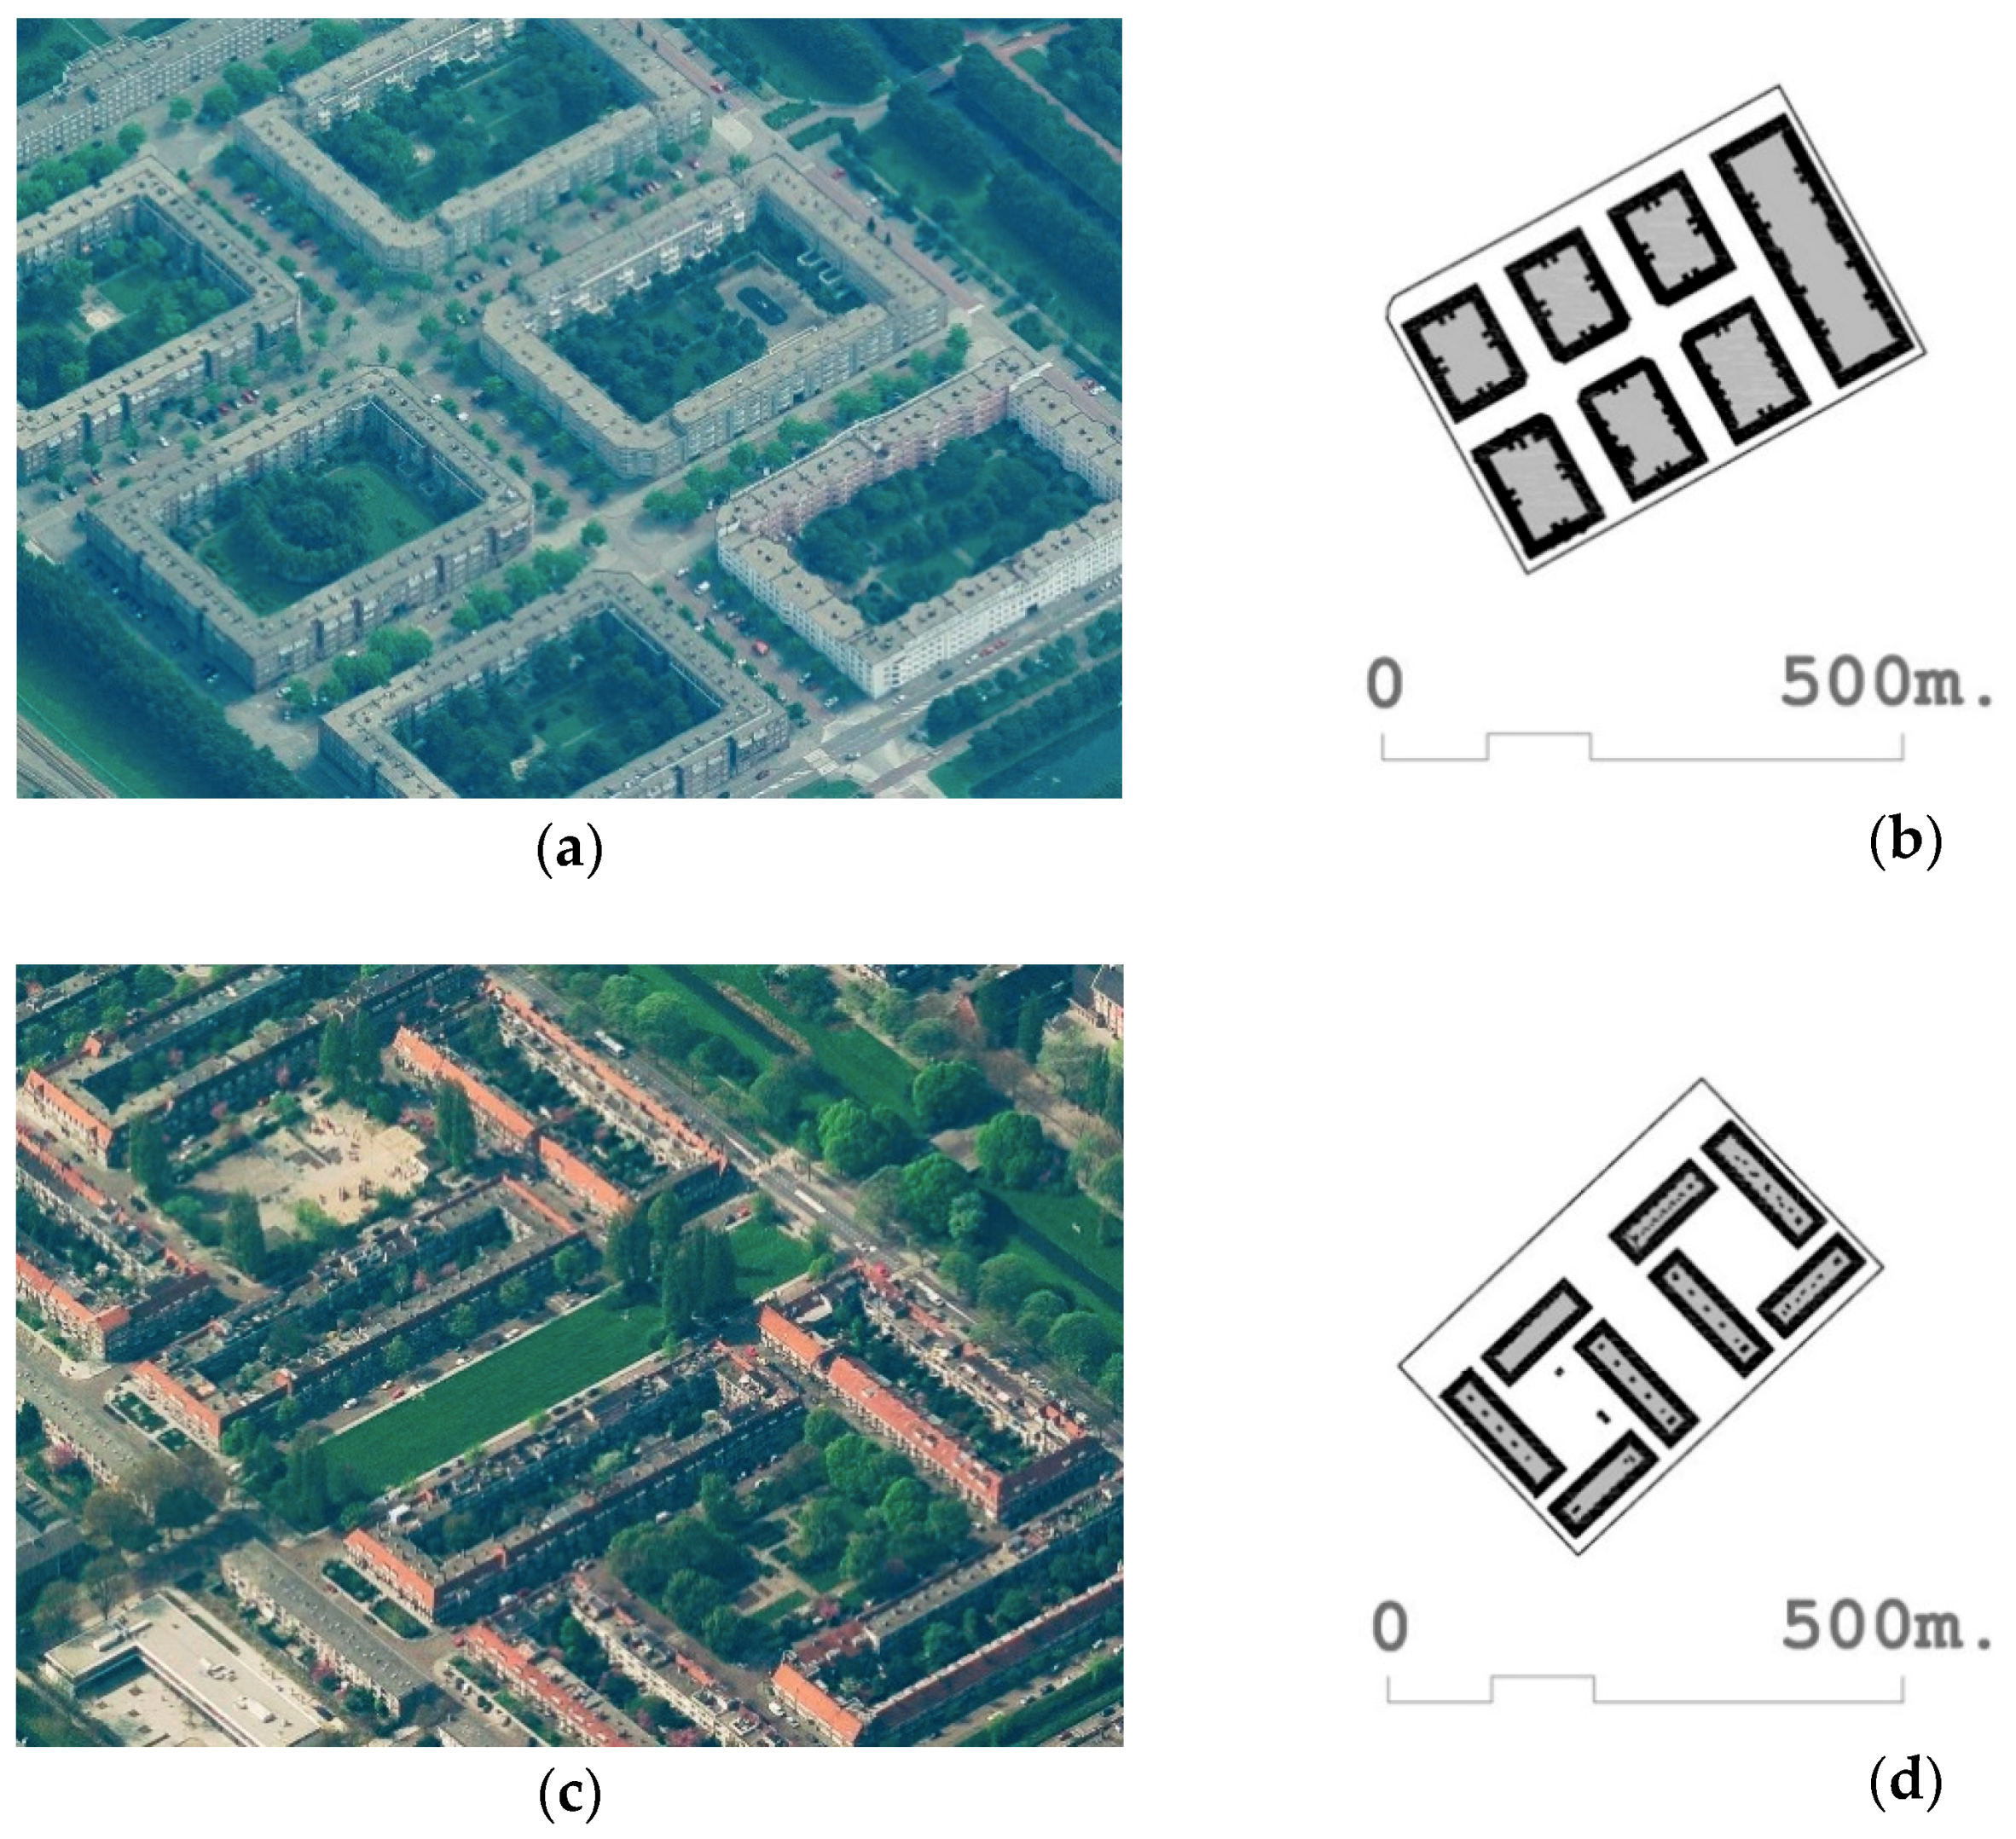
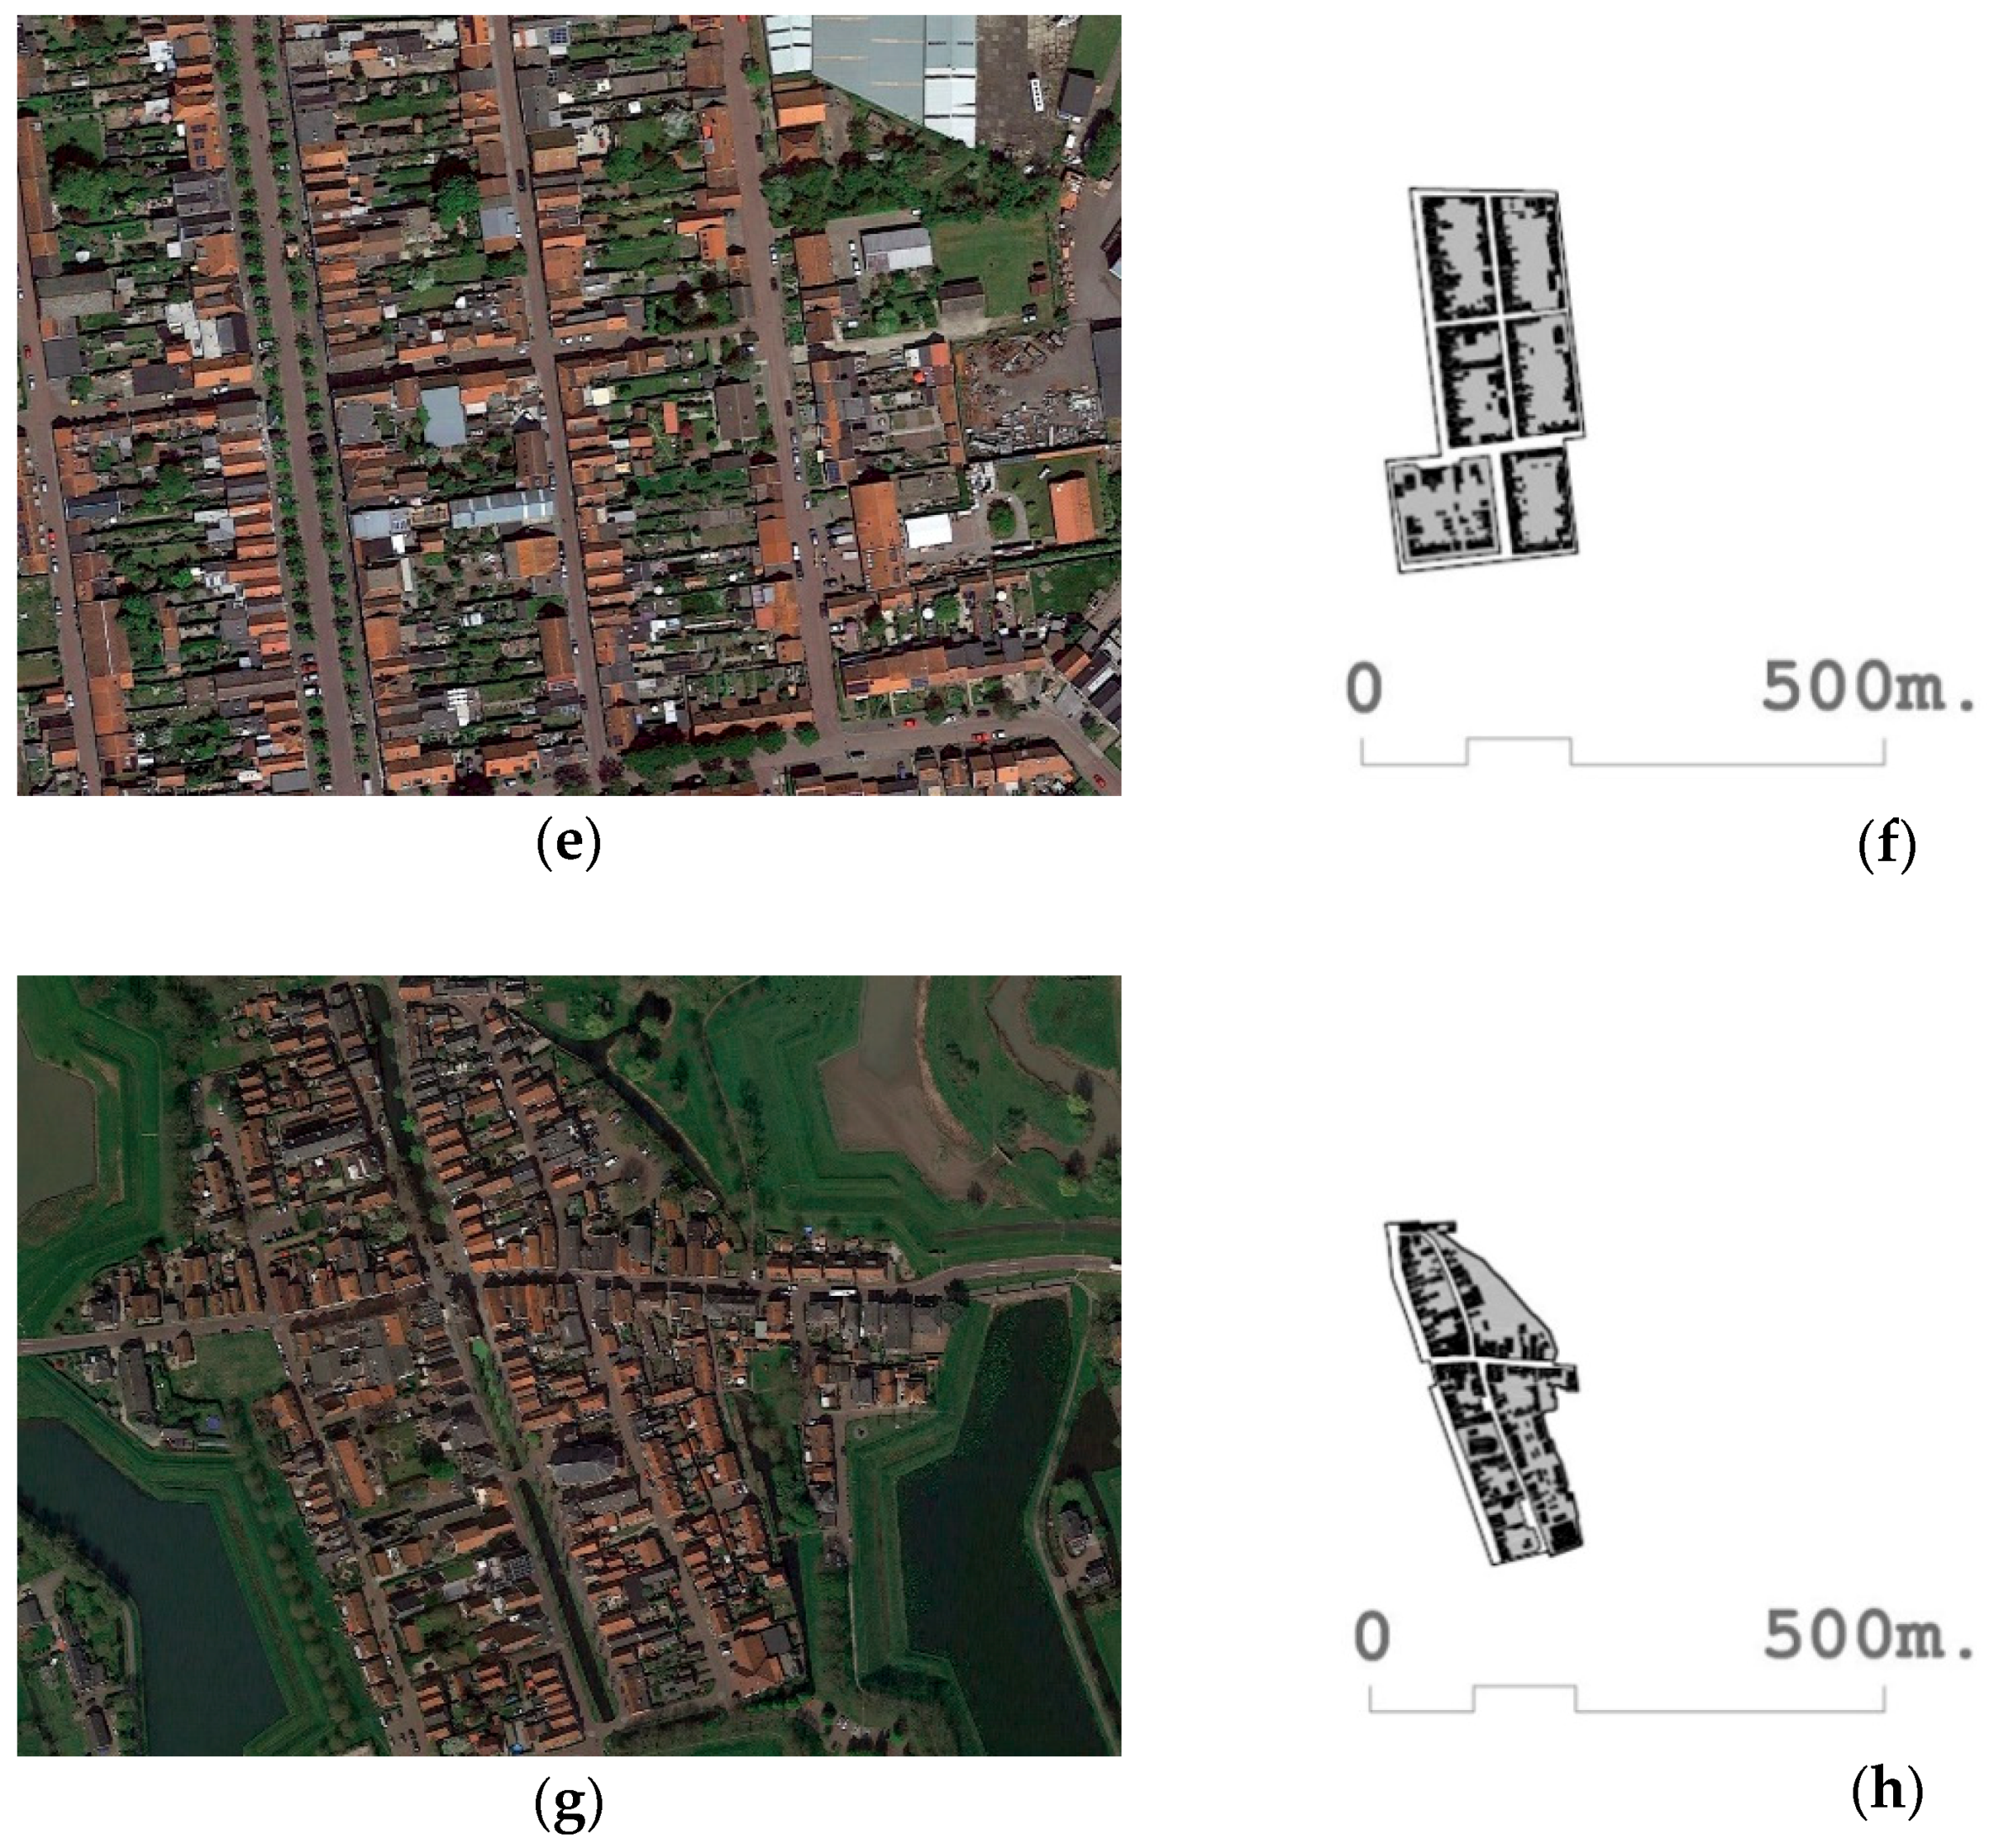
  • In this section, we analyze what happens when we take three variables considered representative by Berghauser Pont and Haupt [29]. This research proposes the use of three fundamental indicators: FSI, GSI, and N. To verify the validity and robustness of the results of this research, we used the fabrics of the [168] Watergraafsmeer 2 and [116] Colijnspaat included in Table 3, the fabric of Watergraafsmeer 2 included in Figure 5c,d, the fabric of Colijnspaat included in Figure 5e,f. It can be observed that although the values of the FSI, GSI, and N of both fabrics are quite similar. For this purpose, the percentile and z-score are provided as indicators in Table 2. However, as can be seen through the floor plan and aerial photographs, the street designs, urban forms, and forms of urban life, and even architectural typologies are certainly shown to be different. In the fabric [168] Watergraafsmeer 2 (Figure 5c,d), the typology of multi-family housing around collective courtyards predominates, as opposed to single-family dwellings with a private plot of fabric [116] Colijnsplaat (Figure 5e,f). It can be seen that Berghauser Pont’s and Haupt’s [29] method of three fundamental indicators is not always optimal when it comes to characterizing and describing the fabrics it studies.
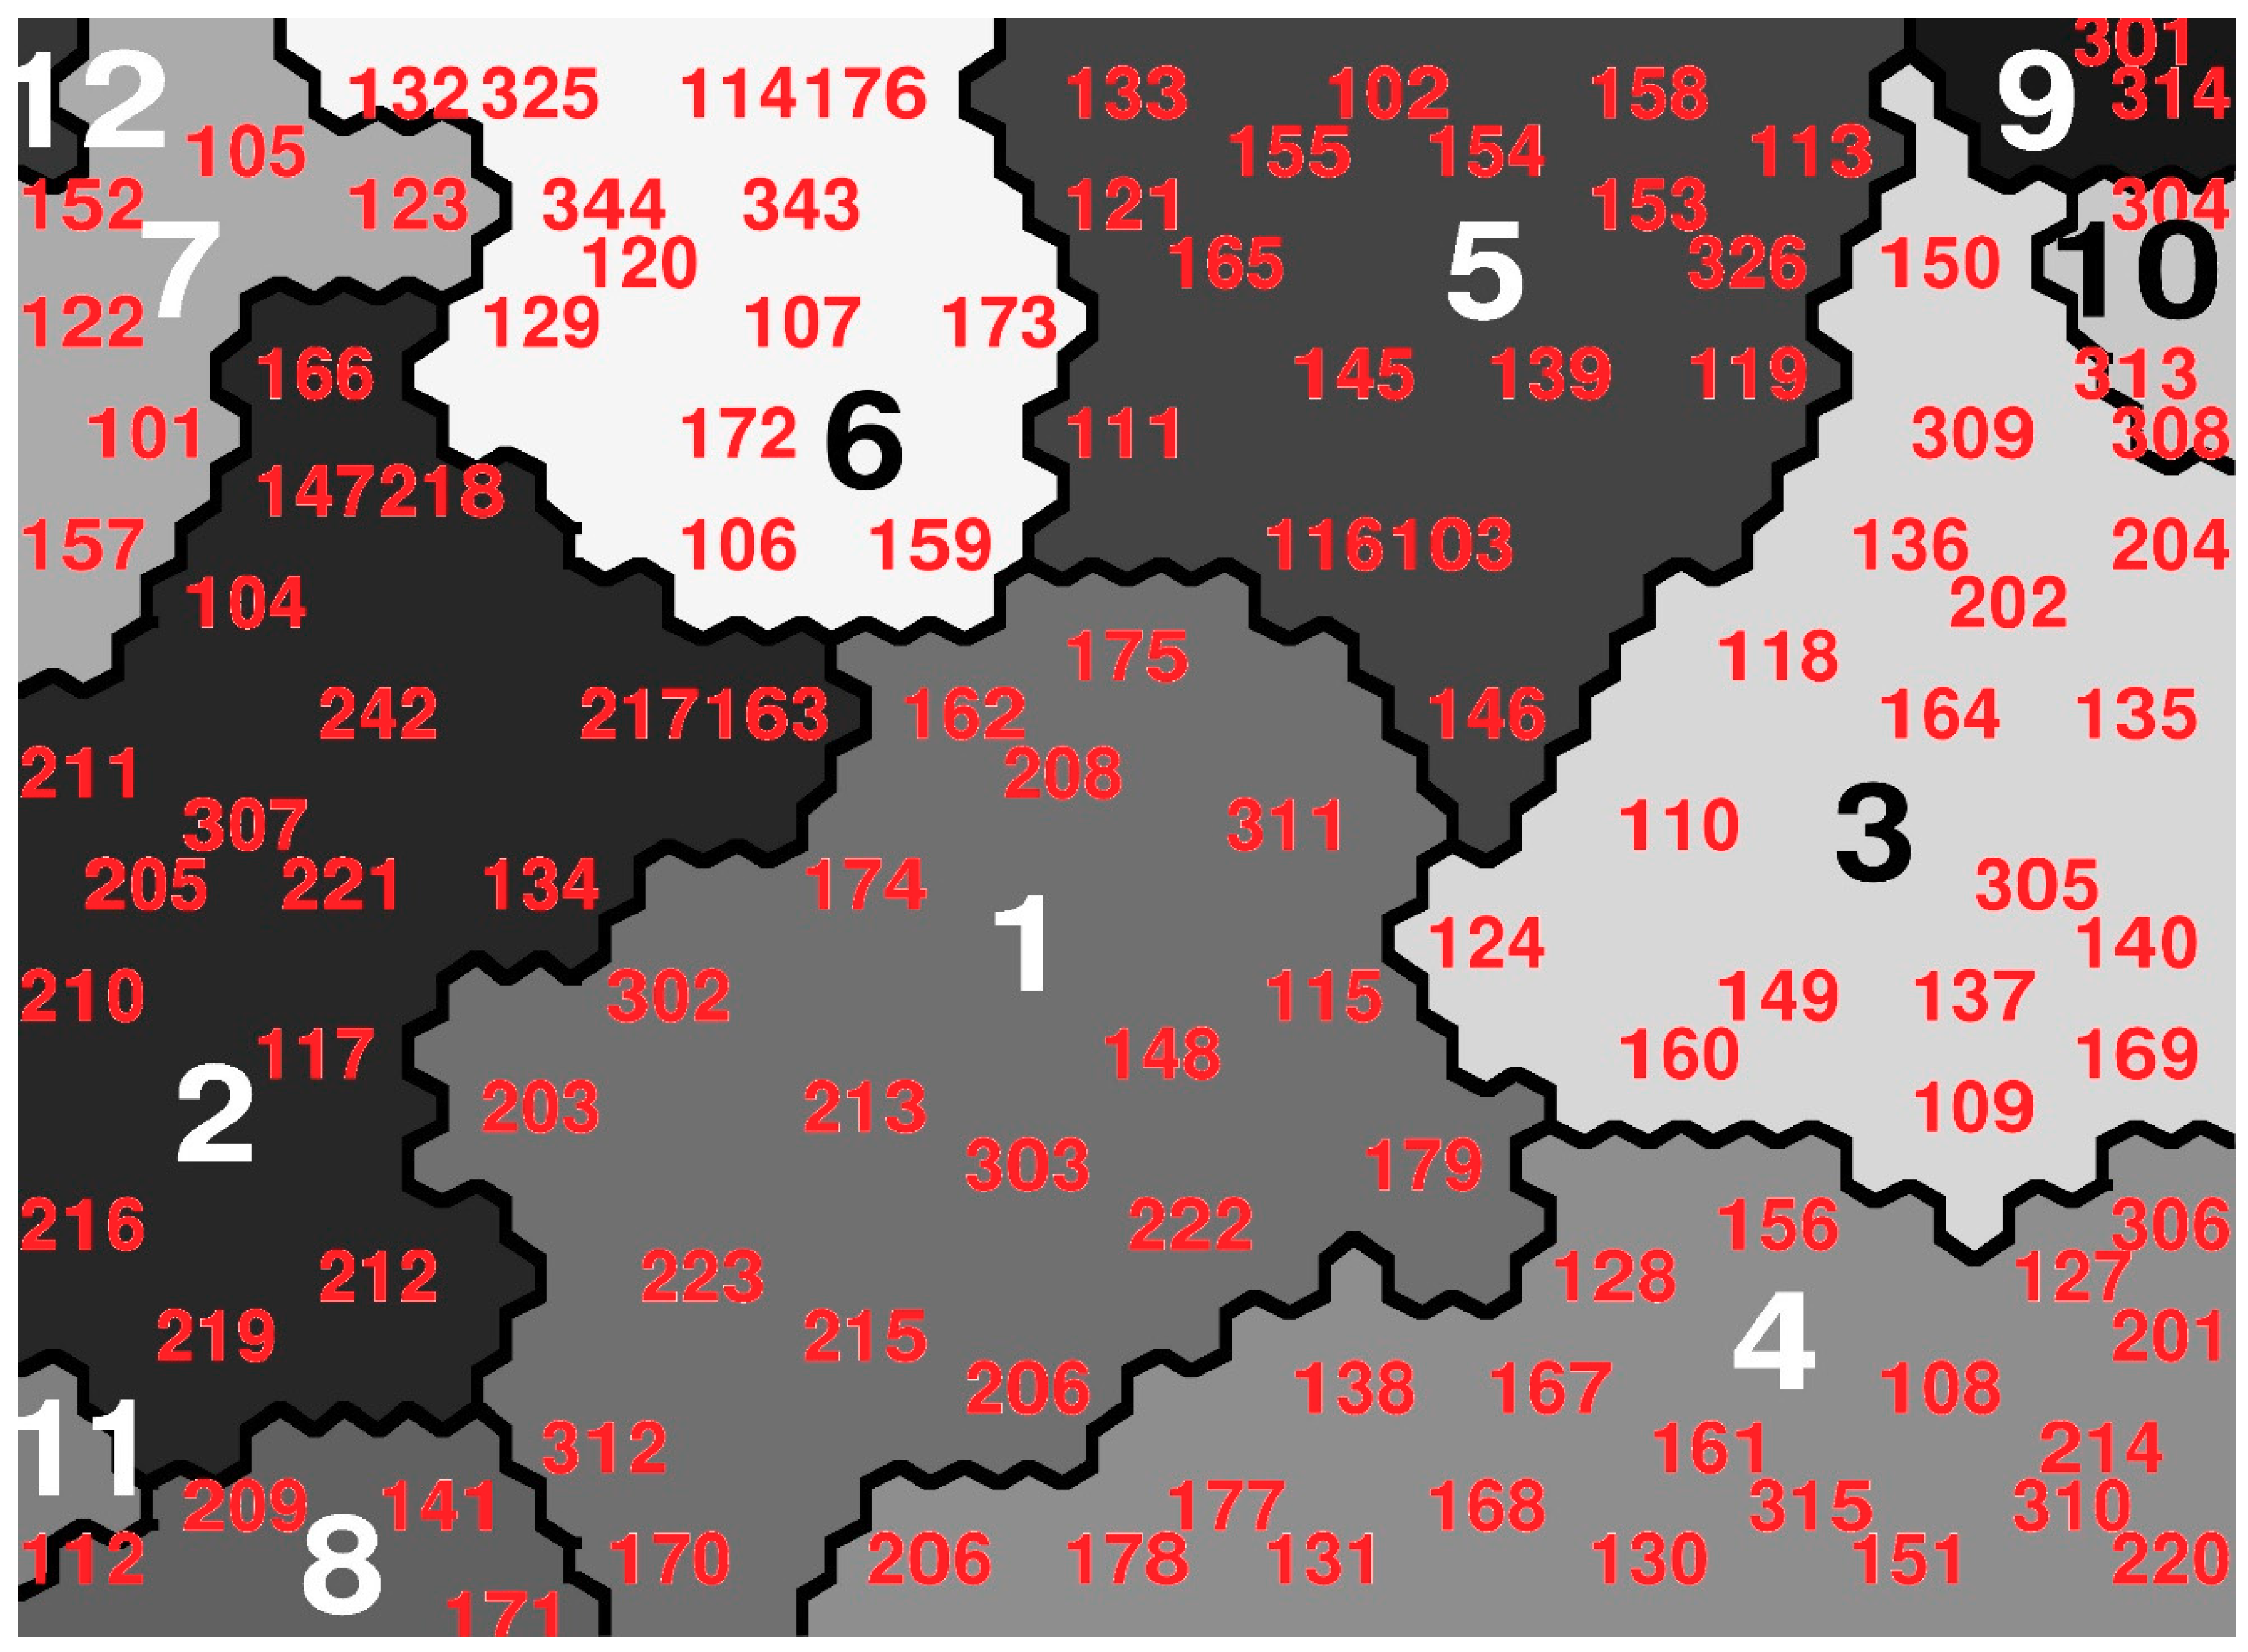
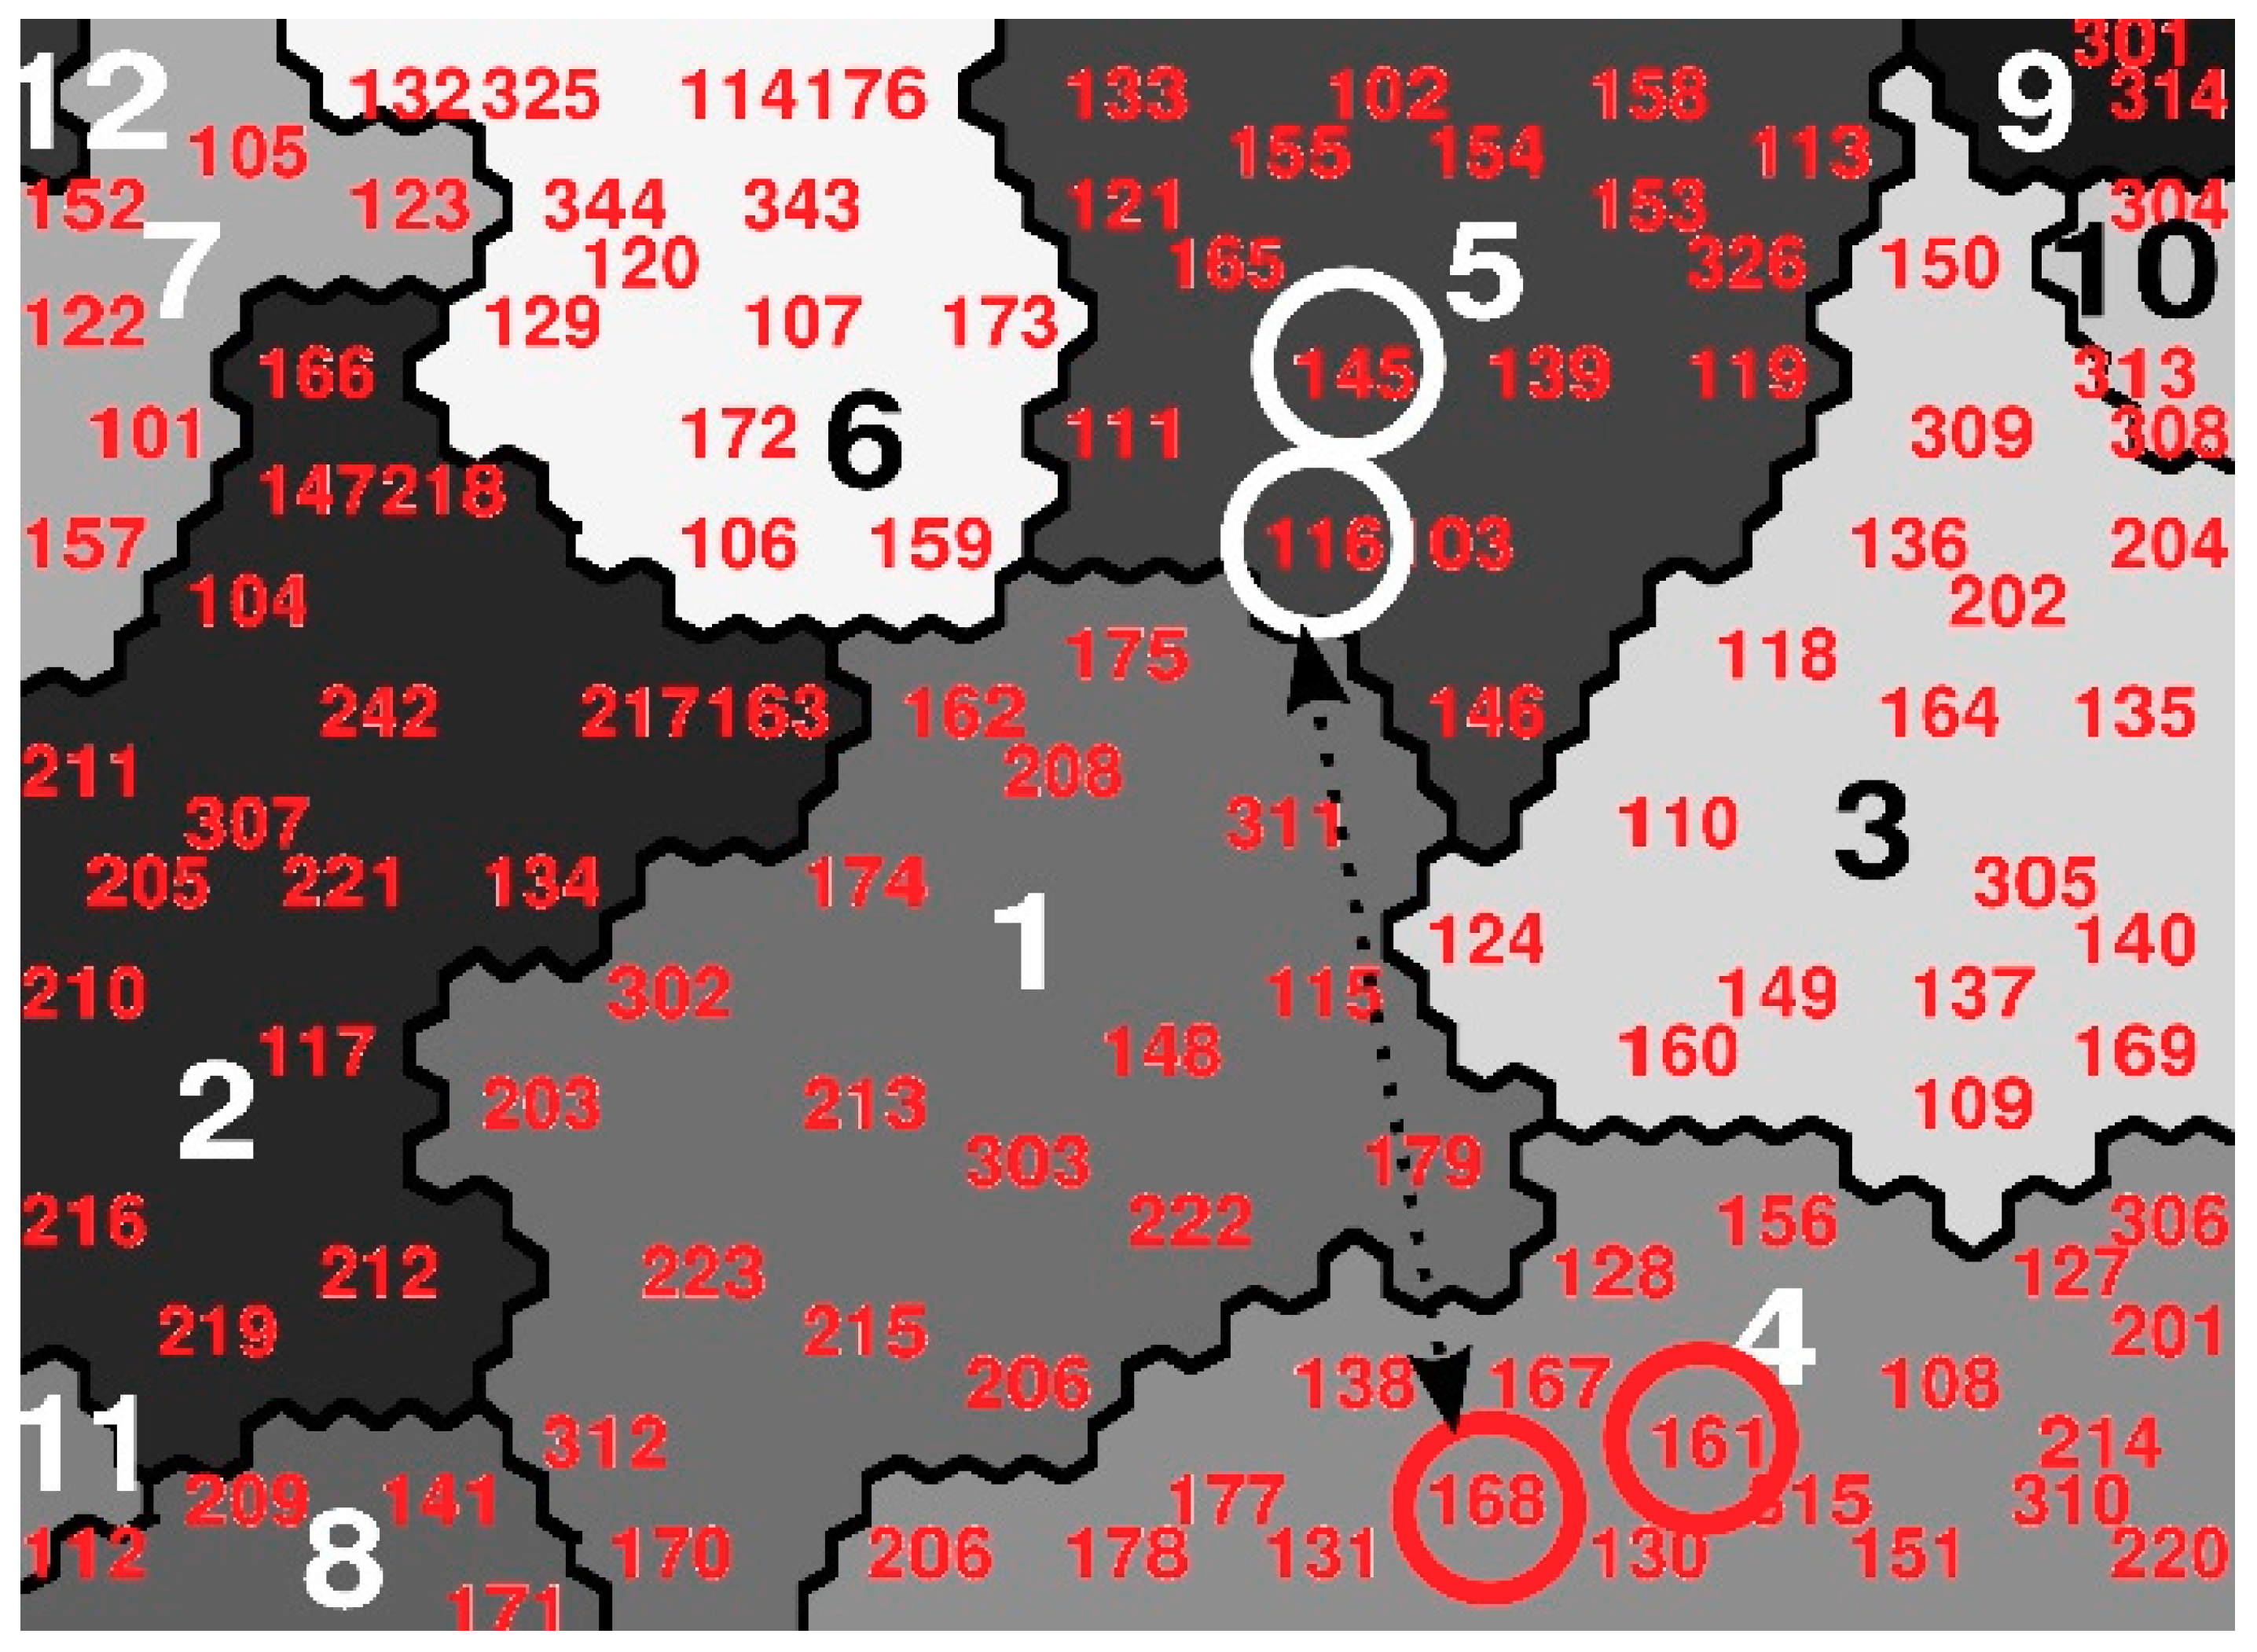
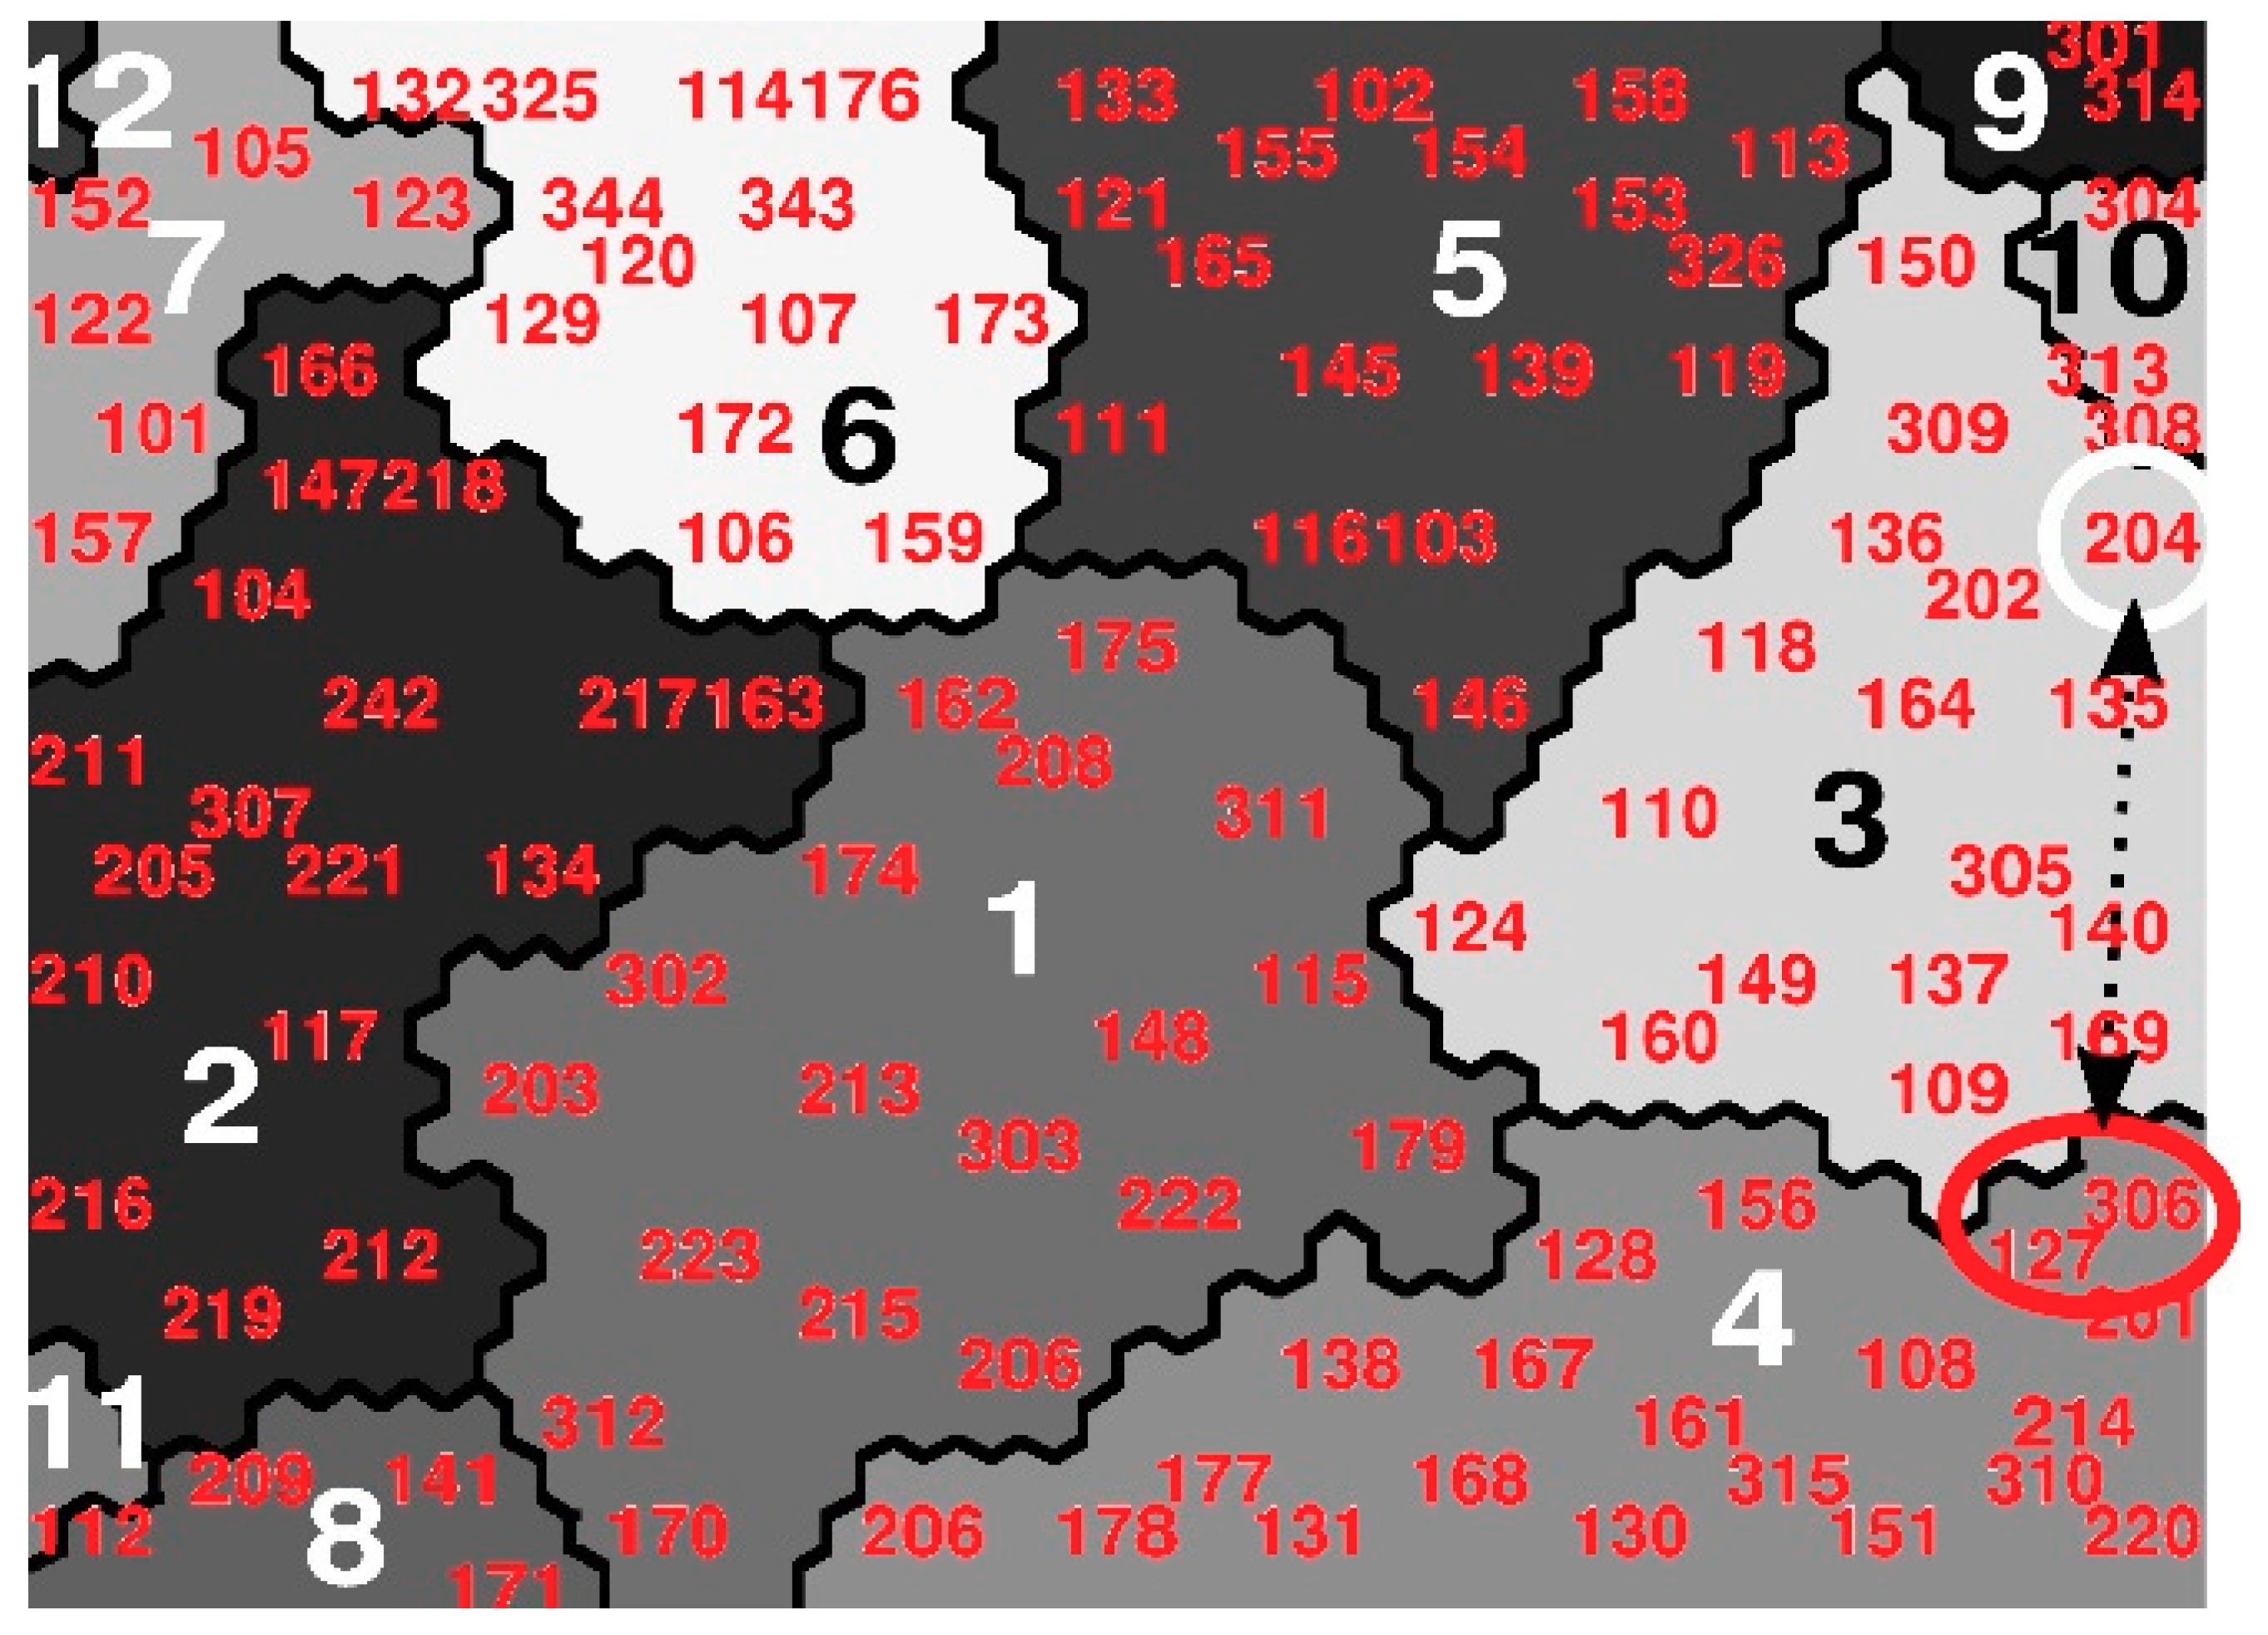
  • One of the main characteristics of SOMs involves the semantic representation through which each entity studied is located on the SOM Map next to those similar entities. We can, thus, evaluate the degree of similarity of the two previous fabrics in relation to the next ones in the SOM map. Thus, in Figure 6, urban fabric circles are marked [161] Venserpolder, [168] Watergraafsmeer 2, [116] Colijnspaat, and [145] Niewpoort. If we first compared the fabric [116] Colijnspaat (Figure 5e,f) with the fabric [145] Niewpoort (Figure 5g,h); we can see that in the SOM map (Figure 6, white circles), they appear very close, as Table 2 verifies that their FSI, GSI, and N values are very similar. On the other hand, if we compare the fabric [168] Watergraafsmeer 2 (Figure 5c,d) with the fabric [161] Venserpolder (Figure 5a,b), which are also close to each other on the SOM map (Figure 6, red circles), Table 2 demonstrates that, unlike the previous ones, they have values of FSI and N with remarkable differences. In Figure 6 we can see that [168] Watergraafsmeer 2 and [161] Venserpolder belong according to SOM analysis to profile 4, and [116] Colijnspaat and [145] Niewpoort to profile 5. If we observe the statistical information in Figure 3, it can be verified, among other things, that the variables Fabric-b and Fabric-T have a special relevance in the definition of profile 4. This means that, for its correct identification, such variables should be used, and not only FSI, GSI, and N. We can conclude that the variables FSI, GSI, and N are not fully effective in characterizing urban fabrics. The methodology proposed in this paper, with the whole use of all the original Spacematrix indicators, is more robust.
  • If the results obtained in the cluster analysis of Berghauser Pont and Olsson [26] are compared with those obtained by means of the SOM methodology, it is possible to observe that, although certain parallelisms and similar classifications exist, certain differences are observed based on the greater robustness of the SOMs, but also due to the use only of the FSI, GSI, and N indicators, instead of the initial 17 indicators. One of the 12 clusters defined in the paper [26], namely Cluster 2, includes fabrics [127] Grachtengordel (Amsterdam), [306] Eixample (Barcelona), and [204] Hackesche Höpe (Berlin). On the other hand, according to the SOM methodology with its 12 clusters, fabrics [127] Grachtengordel and [306] Eixample are included in Profile 4, and, instead, fabric [204] Hackesche Höpe is framed in our work in Profile 3, as can be observed in Figure 7. If we analyze such fabrics, we can observe that there are indeed significant differences between them: [127] Grachtengordel and [306] Eixample show a ‘b’ between 29–32 m and ‘T’ between 35%–36%, and instead [204], Hackesche Höpe shows ‘b = 13 m’ and ‘T = 13%’. Those values are relevant in the definition of street type and public space, and Berghauser Pont and Olsson’s methodology does not use for clustering other indicators different from FSI, GSI, and L [26].
The results obtained from different points of view are considered relevant, being of special interest the capacity of the methodology, through its multi-variable analysis, to facilitate the analysis and understanding of complex data. In this sense, the SOM methodology shows several key advantages. Together with the robustness attributed by the state of the art to its clusters, the maps themselves obtained by means of the SOM methodology, as they topologically organize each and every one of the entities under consideration, allow the comparison of each urban fabric with the other fabrics and with all the profiles obtained. In this sense, the SOM behaves as a data mining tool and at the same time, as an aid system for decision making, clearly distinguishing itself from other methodologies and clustering techniques. This holistic approach to the built density phenomenon facilitates the understanding of urban issues and can consolidate as a tool that improves the understanding of complex matters, allowing, at the same time, the generation of an interaction between architecture and fabrics with other concepts or variables generally distant, such as economy, history, and politics [92]. Thus, it is possible to develop urban methodologies in which the knowledge of past and present realities and dynamics facilitates the creation of new forms based on those of the past, making it possible to delimit future ones from the knowledge.
Research is relevant in as much as it can be applied to various urban planning processes. On the one hand, by knowing the metrics that govern each profile, it is possible to identify neighborhood models or profiles that are considered a reference for their state-of-the-art qualities. In this way, their metrics can be considered as guidelines for the elaboration of new proposals inspired by such models, or they can be useful as a normative framework for the development of a specific territorial scope or of a particular urban plan. Such metrics are usually set by the variables that have been identified with a high effect size, approximating to the mean that presents the profile in such variables within the corresponding framework delimited by the standard deviation. Another plausible option to check the belonging to a profile by means of its analysis with self-organizing maps is to obtain the relative position in the map, thus, identifying whether or not it belongs to the profile.
Base on the results obtained, the universal use of a limited number of indicators is discouraged due to the relative inaccuracy. Likewise, the methodological proposal shows strategic advantages by facilitating comparison between the different fabrics and the profiles obtained and is considered especially relevant in areas of urban planning and design, which generally require quantitative variables for urban regulation and the definition of land use.
If we analyze the limitations of this research, it is worth mentioning those presented by the SOM analysis methodology itself, which are the ones that have the data with which it operates. The data with which we worked refers to 117 urban fabrics that represent neighborhoods from only three countries of origin and no selection process other than the one carried out by the authors of these data [29,30]. This number, although not particularly high, does not present any problems for use by ANNs in a robust and efficient manner. It should also be borne in mind that the SOM model is trained with the data supplied to it so that the results would gain in relevance if the representativeness and exemplarity of the case studies can be guaranteed.
The research and its methodology are totally scalable, and enable the increase of the number of urban fabrics understudy and the adaptation of the successive profiles according to the available information. A greater number and variety of case studies would improve the robustness of the proposed clustering model and the current research is considered as a framework for future research.

5. Conclusions

This work arose to consider the importance of urban density in the configuration of sustainable environments. The state of the art corroborates the complexity of such a concept, highlighting certain gaps, which this work seeks to resolve. These are the identification of density profiles in a robust way and with statistical verifications, the use of a diverse and wide number of density indicators, and their application in several scales, specifically the fabric and island scales. The research also tests the suitability of a limited number of widely accepted indicators in the definition of density, such as FSI, GSI, and N or L.
This research proposes a methodology based on artificial intelligence that facilitates a holistic approach to the concept of density, allowing the integration of its multiple measures and indicators. The main aim was to verify the interest of the methodology to identify urban density profiles, as well as their metrics, based on common indicators of constructed density. The research empirically uses a set of 13 variables selected for their ability to characterize density, which are quantified in a total of 117 different urban fabrics. Twelve differentiated profiles were detected using the clustering methodology based on artificial neural networks called self-organizing maps. The robustness of such profiles was tested by various statistical analyses, including bilateral Student’s t analysis and d-Cohen Effect Size evaluation. The study describes the different metrics that define each of the profiles, which are exclusive and specific to each type of density obtained. These metrics allowed us to make a detailed description of the urban configuration of each density in this paper.
The proposed methodology, based on a multivariable, global and holistic approach, allows the change from a definition of urban morphology and its density, based on discrete, isolated, and universally valid parameters, to a definition based on multiple identities or density profiles, each with its own metrics and indicators that define it precisely in the qualitative identity of the urban form in a global and multivariable way. As was demonstrated, once the urban profile of interest is selected, it can be measured and used to identify the proper metrics and indicators for its replication.
The results obtained represent a certain break with those approximations of the state of the art that define the built density through a limited number of variables, universally valid for any type of configuration and urban context. These results may have an impact on the way in which urban planning and planning regulations define urban form through urban rules or ordinances.
This work is especially considered relevant at the methodological level. Self-organizing maps have rarely been used in morphological analyses or in the study of urban fabrics. Among its main advantages over other methodologies, such as cluster analysis and K-Means, is the robustness of the clusters obtained, validated by the state of the art, as well as the interest of its graphic representations or maps that characterize it. These maps allow comparisons to be made between the different urban fabrics and the profiles identified from them, turning them into a tool for the generation of knowledge and for decision support. In any case, this tool can be completed with a greater number of case studies, as well as with the incorporation and justified suppression of indicators of the built density that adapt pertinently to the specific field of study and to the issues that are considered relevant.
From the research carried out, it can be concluded that urban density must be observed from multiple parameters, or metrics, using specific variables to define a built density. Therefore, there is no single type of density that can be measured by universal indicators, but, rather, there are multiple types of different densities, each of which must be characterized by its own metrics and indicators.

Author Contributions

Conceptualization: F.J.A.-A.; methodology: F.J.A.-A.; software: F.J.A.-A.; validation: F.J.A.-A., F.S.C.-S., and F.O.-P.; formal analysis: F.J.A.-A.; investigation: F.J.A.-A., F.S.C.-S., and F.O.-P.; resources: F.J.A.-A.; data curation: F.J.A.-A.; writing—original draft preparation: F.J.A.-A.; writing—review and editing: F.J.A.-A., F.S.C.-S., and F.O.-P.; visualization: F.J.A.-A.; project administration: F.J.A.-A.; funding acquisition: F.J.A.-A.

Funding

This research was funded by the University of Granada, grant number PP2016-PIP09 and their authors.

Acknowledgments

The authors wish to acknowledge the helpful and constructive criticisms of a referee, many of whose suggestions have been adopted in revising this paper.

Conflicts of Interest

The authors declare no conflict of interest.

References

  1. Krehl, A.; Siedentop, S.; Taubenbsck, H.; Wurm, M. A comprehensive view on urban spatial structure: Urban density patterns of German city regions. ISPRS Int. J. Geo-Inf. 2019, 5, 76. [Google Scholar] [CrossRef]
  2. Kenworthy, J.R.; Laube, F.B. Automobile dependence in cities: An international comparison of urban transport and land use patterns with implications for sustainability. Environ. Impact Assess. Rev. 1996, 16, 279–308. [Google Scholar] [CrossRef]
  3. Kenworthy, J.R.; Laube, F.B. Patterns of Automobile Dependence in Cities: An International Overview of Key Physical and Economic Dimensions with Some Implications for Urban Policy. Transp. Res. Part A-Policy Pr. 1999, 33, 691–723. [Google Scholar] [CrossRef]
  4. Zhang, M. Travel Choice with No Alternative. J. Plan. Educ. Res. 2006, 25, 311–326. [Google Scholar] [CrossRef]
  5. Marshall, J.D. Energy-efficient urban form. Environ. Sci. Technol. 2008, 42, 3133–3137. [Google Scholar] [CrossRef] [PubMed]
  6. Naess, P. Residential Location, Travel Behaviour, and Energy Use: Hangzhou Metropolitan Area Compared to Copenhagen. Indoor Built Environ. 2009, 18, 382–395. [Google Scholar] [CrossRef]
  7. Calthorpe, P. The Next American Metropolis: Ecology, Community, and the American Dream; Princeton Architectural Press: New York, NY, USA, 1993; ISBN 9781878271686. [Google Scholar]
  8. Smyth, J. The economic power of sustainable development: Building the new American dream. In Sustainable Cities: Concepts and Strategies for Eco-City Development; Walter, B., Arkin, L., Crenshaw, R.W., Eds.; Eco-Home Media: Los Angeles, CA, 1992; p. 354. ISBN 9780963351104. [Google Scholar]
  9. Scully, V. The architecture of community. In The New Urbanism: Toward An Architecture of Community; Katz, P., Ed.; McGraw-Hill: New York, NY, USA, 1994. [Google Scholar]
  10. Churchman, A. A Study of Attitudes towards Housing Issues in the City of Tel Aviv; Technion, Center for Urban and Regional Studies: Haifa, Israel, 1998. [Google Scholar]
  11. Jacobs, J. The Death and Life of Great American Cities; Jonathan Cape: London, UK, 1962. [Google Scholar]
  12. Trigaux, D.; Allacker, K.; De Troyer, F. Life Cycle Assessment of Land Use in Neighborhoods. Procedia Environ. Sci. 2017, 38, 595–602. [Google Scholar] [CrossRef]
  13. Hossain, M.M. Towards Sustainable Urban Environment: An Investigation on the Relationship between Electrical Energy Consumption and Urban Morphology in Context of Dhaka City. In Proceedings of the 2nd International Conference on Sustainable Architecture and Urban Development (SAUD), Amman, Jordan, 12–14 July 2010; pp. 387–402. [Google Scholar]
  14. Hénon, A.; Mestayer, P.G.; Lagouarde, J.P.; Voogt, J.A. An urban neighborhood temperature and energy study from the CAPITOUL experiment with the SOLENE model: Part 1: Analysis of flux contributions. Appl. Clim. 2012, 110, 177–196. [Google Scholar] [CrossRef]
  15. Gusson, C.S.; Duarte, D.H.S. Effects of Built Density and Urban Morphology on Urban Microclimate - Calibration of the Model ENVI-met V4 for the Subtropical Sao Paulo, Brazil. Procedia Eng. 2016, 169, 2–10. [Google Scholar] [CrossRef]
  16. Ahmadian, E.; Sodagar, B.; Mills, G.; Byrd, H.; Bingham, C.; Zolotas, A. Sustainable cities: The relationships between urban built forms and density indicators. Cities 2019, 95, 102382. [Google Scholar] [CrossRef]
  17. Kang, C.D. Effects of spatial access to neighborhood land-use density on housing prices: Evidence from a multilevel hedonic analysis in seoul, South Korea. Environ. Plan. B Urban Anal. City Sci. 2019, 46, 603–625. [Google Scholar] [CrossRef]
  18. Jabareen, Y.R. Sustainable urban forms - Their typologies, models, and concepts. J. Plan. Educ. Res. 2006, 26, 38–52. [Google Scholar] [CrossRef]
  19. Churchman, A. Disentangling the concept of density. J. Plan. Lit. 1999, 13, 389–411. [Google Scholar] [CrossRef]
  20. Alexander, E.R. Density Measures: A Review and Analysis. J. Arch. Plann. Res. 1993, 10, 181–202. [Google Scholar] [CrossRef]
  21. Ahlfeldt, G.M.; Pietrostefani, E. The Compact City in Empirical Research: A Quantitative Literature Review; London School of Economics and Political Science, LSE Library: London, UK, 2017. [Google Scholar]
  22. Grosvenor, M.; O’Neill, P. The density debate in urban research: An alternative approach to representing urban structure and form. Geogr. Res. 2014, 52, 442–458. [Google Scholar] [CrossRef]
  23. Lehmann, S. Sustainable urbanism: Towards a framework for quality and optimal density? Futur. Cities Environ. 2016, 2, 8. [Google Scholar] [CrossRef]
  24. Moroni, S. Urban density after Jane Jacobs: The crucial role of diversity and emergence. CityTerrit. Arch. 2016, 3, 1–8. [Google Scholar] [CrossRef]
  25. Turok, I. Housing and the urban premium. Habitat Int. 2016, 54, 234–240. [Google Scholar] [CrossRef]
  26. Berghauser Pont, M. Typology based on three density variables central to Spacematrix using cluster analysis. In Proceedings of the 24th ISUF International Conference, Valencia, Spain, 27–29 September 2017; pp. 1337–1348. [Google Scholar]
  27. Haupt, P.; Berghauser Pont, M.; Vernez·Moudon, A. Spacemate: The Spatial Logic of Urban Density; Delft University Press: Delft, The Netherlands, 2002. [Google Scholar]
  28. Berghauser Pont, M.; Haupt, P.A. The relation between urban form and density. Urban Morphol. 2007, 11, 62–65. [Google Scholar]
  29. Berghauser Pont, M.; Haupt, P.A. Spacematrix: Space, Density and Urban Form; Nai Publishers: Rotterdam, The Netherlands, 2010. [Google Scholar]
  30. Berghauser Pont, M. Space, Density and Urban Form; Technische Universiteit Delft: Delft, The Netherlands, 2009. [Google Scholar]
  31. Southworth, M.; Ben Joseph, E. Street and Shaping of Towns and Cities; Island Press: Washington, DC, USA, 2003. [Google Scholar]
  32. Cerdà, I. Teoría General de la Urbanización, y Aplicación de sus Principios y Doctrinas a la Reforma y Ensanche de Barcelona; Imprenta Española: Madrid, Spain, 1867. [Google Scholar]
  33. Howard, E. Tomorrow: A Peaceful Path to Real Reform; Stout, F., Legates, R., Eds.; Routledge: London, UK, 1898; Volume 2, ISBN 0415160855. [Google Scholar]
  34. Unwin, R. Nothing Gained by Overcrowding! How the Garden City Type of Development May Benefit Both Owner and Occupier; King and Son: Wesminster, UK; Londres, UK, 1912. [Google Scholar]
  35. Whyte, I.B.; Frisby, D. Metropolis Berlin: 1880–1940; University of California Press: London, UK, 2012; ISBN 9780520270374. [Google Scholar]
  36. Lehnerer, A. Grand Urban Rules; 010 Publishers: Rotterdam, The Netherlands, 2009; ISBN 9789064506666. [Google Scholar]
  37. Radberg, J. Doktrin och Täthet i Svenskt Stadsbyggande 1875-1975; Statens rad för byggnadsforskning: Estocolmo, Swedish, 1988. [Google Scholar]
  38. Martin, L.; March, L. Urban Space and Structures; Cambridge University Press: Cambridge, UK, 1972. [Google Scholar]
  39. Steadman, P. Density and built form: Integrating “Spacemate” with the work of Martin and March. Environ. Plan. B Plan. Des. 2014, 41, 341–358. [Google Scholar] [CrossRef]
  40. Schirmer, P.M.; Axhausen, K.W. A multiscale classification of urban morphology. J. Transp. Land Use 2016, 9, 101–130. [Google Scholar] [CrossRef]
  41. Kohonen, T. Self-organized formation of topologically correct feature maps. Biol. Cybern. 1982, 43, 59–69. [Google Scholar] [CrossRef]
  42. Ritter, H.; Kohonen, T. Self-organizing semantic maps. Biol. Cybern. 1989, 61, 241–254. [Google Scholar] [CrossRef]
  43. Weiss, S.M.; Indurkhya, N. Predictive Data Mining: A Practical Guide; Morgan Kaufmann: San Francisco, United States, 1998; ISBN 1558604030. [Google Scholar]
  44. Demartines, P.; Blayo, F. Kohonen Self-Organizing Maps: Is the Normalization Necessary? Complex Syst. 1992, 6, 105–123. [Google Scholar]
  45. Jagric, T.; Bojnec, S.; Jagric, V. Optimized spiral spherical self-organizing map approach to sector analysis—The case of banking. Expert Syst. Appl. 2015, 42, 5531–5540. [Google Scholar] [CrossRef]
  46. Saitoh, F. Visualization of online customer reviews and evaluations based on self-organizing map. In Proceedings of the 2014 IEEE International Conference on Systems, Man, and Cybernetics (SMC), San Diego, CA, USA, 5–8 October 2014; pp. 176–181. [Google Scholar] [CrossRef]
  47. Tabrizi, T.S.; Khoie, M.R.; Sahebkar, E.; Rahimi, S.; Marhamatil, N. Towards a Patient Satisfaction Based Hospital Recommendation System. In Proceedings of the 2016 International Joint Conference on Neural Networks (IJCNN), Vancouver, BC, Canada, 24–29 July 2016; pp. 131–138. [Google Scholar]
  48. Martín Guerrero, J.D.; Marcelli, D.; Soria-Olivas, E.; Mari, F.; Martínez-Martínez, J.M.; Soley Bech, I.; Martínez-Sober, M.; Scatizzi, L.; Gómez-Sanchis, J.; Stopper, A.; et al. Self-Organising Maps: A new way to screen the level of satisfaction of dialysis patients. Expert Syst. Appl. 2012, 39, 8793–8798. [Google Scholar] [CrossRef]
  49. Park, D.H.; Kim, H.K.; Choi, I.Y.; Kim, J.K. A literature review and classification of recommender systems research. Expert Syst. Appl. 2012, 39, 10059–10072. [Google Scholar] [CrossRef]
  50. Bação, F.; Lobo, V.; Painho, M. Self-organizing maps as substitutes for k-means clustering. Comput. Sci. 2005, 3516, 476–483. [Google Scholar] [CrossRef]
  51. Vesanto, J. SOM-based data visualization methods. Intell. Data Anal. 1999, 3, 111–126. [Google Scholar] [CrossRef]
  52. Kohonen, T.; Oja, E.; Simula, O.; Visa, A.; Kangas, J. Engineering applications of the self-organizing map. Proc. IEEE 1996, 84, 1358–1384. [Google Scholar] [CrossRef]
  53. Kaski, S.; Kohonen, T. Exploratory Data Analysis By The Self-Organizing Map: Structures Of Welfare And Poverty In The World (1996). In Neural Networks in Financial Engineering. Proceedings of the Third International Conference on Neural Networks in the Capital Markets; World Scientific: Singapore, 1996; pp. 498–507. [Google Scholar]
  54. Kropp, J. A neural network approach to the analysis of city systems. Appl. Geogr. 1998, 18, 83–96. [Google Scholar] [CrossRef]
  55. Takatsuka, M. An application of the Self-Organizing Map and interactive 3-D visualization to geospatial data. In Proceedings of the 6th International Conference on Geocomputation, Brisbane, Australia, 24–26 September 2001. [Google Scholar]
  56. Diappi, L.; Bolchim, P.; Buscema, M. Improved Understanding of Urban Sprawl Using Neural Networks. In Recent Advances in Design and Decision Support Systems in Architecture and Urban Planning; Van-Leeuwen, J.P., Timmermans, H.J.P., Eds.; Springer: Milan, Italy, 2004; pp. 33–49. ISBN 1-4020-2408-8. [Google Scholar]
  57. Hatzichristos, T. Delineation of demographic regions with GIS and computational intelligence. Environ. Plan. B Plan. Des. 2004, 31, 39–49. [Google Scholar] [CrossRef]
  58. Kauko, T. Using the self-organising map to identify regularities across country-specific housing-market contexts. Environ. Plan. B Plan. Des. 2005, 32, 89–110. [Google Scholar] [CrossRef] [Green Version]
  59. Guo, D.; Chen, J.; MacEachren, A.M.; Liao, K. A Visualization System for Space-Time and Multivariate Patterns (VIS-STAMP). IEEE Trans. Vis. Comput. Graph. 2006, 12, 1461–1474. [Google Scholar] [CrossRef] [Green Version]
  60. Spielmans, S.E.; Thill, J.-C. Social area analysisss, data mining, and GIS. Comput. Environ. Urban Syst. 2008, 32, 110–122. [Google Scholar] [CrossRef]
  61. Behnisch, M.; Ultsch, A. Urban data-mining: Spatiotemporal exploration of multidimensional data. Build. Res. Inf. 2009, 37, 520–532. [Google Scholar] [CrossRef]
  62. Hagen-Zanker, A.; Timmermans, H.J.P. A Metric of Compactness of Urban Change Illustrated to 22 European Countries. In The European Information Society; Springer: Berlin/Heidelberg, Germany, 2009; pp. 181–200. [Google Scholar]
  63. Abarca-Alvarez, F.J.; Fernandez-Avidad, A. Generation of downtown planning-ordinances using self organizing maps. In Proceedings of the 10th International Conference on Design and Decision Support Systems in Architecture and Urban Planning, Eindhoven, The Nether lands, 19–22 July 2010; pp. 63–79. [Google Scholar]
  64. Skupin, A.; Esperbé, A. An alternative map of the United States based on an n-dimensional model of geographic space. J. Vis. Lang. Comput. 2011, 22, 290–304. [Google Scholar] [CrossRef]
  65. Abarca-Alvarez, F.J.; Osuna-Pérez, F. Cartografías semánticas mediante redes neuronales: Los mapas auto-organizados (SOM) como representación de patrones y campos. Ega. Rev. Expresión Gráfica Arquit. 2013, 18. [Google Scholar] [CrossRef] [Green Version]
  66. Campos-Sánchez, F.S.; Abarca-Álvarez, F.J.; Serra-Coch, G.; Chastel, C. Evaluación comparativa del nivel de Desarrollo Orientado al Transporte (DOT) en torno a nodos de transporte de grandes ciudades: Métodos complementarios de ayuda a la decisión. Eure. Rev. Lat. Estud. Urbanos Reg. 2019, 45, 5–30. [Google Scholar] [CrossRef]
  67. Abarca-Alvarez, F.J.; Navarro-Ligero, M.L.; Valenzuela-Montes, L.M.; Campos-Sánchez, F.S. European Strategies for Adaptation to Climate Change With the Mayors Adapt Initiative by Self-Organizing Maps. Appl. Sci. 2019, 9, 3859. [Google Scholar] [CrossRef] [Green Version]
  68. Abarca-alvarez, F.J.; Campos-Sánchez, F.S.; Mora-Esteban, R. Survey Assessment for Decision Support Using Self-Organizing Maps Profile Characterization with an Odds and Cluster Heat Map: Application to Children’s Perception of Urban School Environments. Entropy 2019, 21, 916. [Google Scholar] [CrossRef] [Green Version]
  69. Cherkassky, V.S.; Friedman, J.H. From Statics to Neural Networks: Theory and Pattern Recognition Appications; Wechsler, H., Ed.; Springer: Berlin, Germany, 1994. [Google Scholar]
  70. Pitarque, A.; Roy, J.F.; Ruiz, J.C. Redes neuronales vs modelos estadísticos: Simulaciones sobre tareas de predicción y clasificación. Psicológica 1998, 19, 387–400. [Google Scholar]
  71. Cottrell, M.; Letrémy, P. How to use the Kohonen algorithm to simultaneously analyze individuals and modalities in a survey. Neurocomputing 2005, 63, 193–207. [Google Scholar] [CrossRef] [Green Version]
  72. Hamaina, R.; Leduc, T.; Moreau, G. Towards Urban Fabrics Characterization based on Buildings Footprints. In Bridging the Geographic Information Sciences; Gensel, J., Ed.; Springer: Berlin, Germany, 2012; pp. 231–248. ISBN 978-3-642-29063-3. [Google Scholar]
  73. Yan, J.; Thill, J.-C. Visual data mining in spatial interaction analysis with self-organizing maps. Environ. Plan. B Plan. Des. 2009, 36, 466–486. [Google Scholar] [CrossRef]
  74. Cottrell, M.; Letrémy, P. Analyzing surveys using the Kohonen algorithm. In Proceedings of the ESANN 2003, 11th European Symposium on Artificial Neural Networks, Bruges, Belgium, 23–25 April 2003. [Google Scholar]
  75. Lagus, K.; Vatanen, T.; Kettunen, O.; Heikkil, A.; Heikkil, M.; Pantzar, M.; Honkela, T. Paths of wellbeing on self-organizing maps. In Advances in Self-Organizing Maps; Springer: Berlin, Germany, 2013; pp. 345–352. [Google Scholar] [CrossRef]
  76. Kamiura, N.; Saitoh, A.; Isokawa, T.; Matsui, N. Classification of Interview Sheets Using Self-Organizing. In Proceedings of the 19th International Conference on Neural Information Processing (ICONIP), Doha, Qatar, 12–15 November 2012; pp. 148–155. [Google Scholar]
  77. Ketchen, D.J.; Shook, C.L. The Application Of Cluster Analysis In Strategic Management Reseach: An Anlysis and Critique. Strat. Manag. J. 1996, 17, 441–458. [Google Scholar] [CrossRef]
  78. Zhao, Q.; Xu, M.; Fränti, P. Sum-of-Squares Based Cluster Validity Index and Significance Analysis. In Adaptative and Natural Computing Algorithms. 9th International Conference, ICANNGA 2009. Kuopio, Finland, April 2009; Springer: Berlin, Germany, 2009; Volume 9, pp. 313–322. ISBN 978-3-642-04920-0. [Google Scholar]
  79. Ball, G.H.; Hall, D.J. A Novel Method of Data Analysis Andpattern Classification; Standford Research Institute: Menlo Park, CA, USA, 1965. [Google Scholar]
  80. Calinski, T.; Harabasz, J. A Dendrite Method for Cluster Analysis. Commun. Stat. 1974, 3, 1–27. [Google Scholar]
  81. Davies, D.L.; Bouldin, D.W. A Cluster Separation Measure. IEEE Trans. Pattern Anal. Mach. Intell. 1979, PAMI-1, 224–227. [Google Scholar] [CrossRef]
  82. Lletí, R.; Ortiz, M.C.; Sarabia, L.A.; Sánchez, M.S. Selecting variables for k-means cluster analysis by using a genetic algorithm that optimises the silhouettes. Anal. Chim. Acta 2004, 515, 87–100. [Google Scholar] [CrossRef]
  83. Desgraupes, B. Clustering Indices. CRAN Package 2017, nov, 1–34. [Google Scholar]
  84. Arbelaitz, O.; Gurrutxaga, I.; Muguerza, J.; Pérez, J.M.; Perona, I. An extensive comparative study of cluster validity indices. Pattern Recognit. 2013, 46, 243–256. [Google Scholar] [CrossRef]
  85. Faggiano, L.; de Zwart, D.; García-Berthou, E.; Lek, S.; Gevrey, M. Patterning ecological risk of pesticide contamination at the river basin scale. Sci. Total Environ. 2010, 408, 2319–2326. [Google Scholar] [CrossRef] [PubMed]
  86. Wu, P.K.; Hsiao, T.C. Factor Knowledge Mining Using the Techniques of AI Neural Networks and Self-Organizing Map. Int. J. Distrib. Sens. Netw. 2015. [Google Scholar] [CrossRef]
  87. Wasserstein, R.L.; Lazar, N.A. The ASA’s statement on p-values: Context, process, and purpose. Am. Stat. 2016, 70, 129–133. [Google Scholar] [CrossRef] [Green Version]
  88. Coe, R.; Merino, C. Magnitud del efecto: Una guía para investigadores y usuarios. Rev. Psicol. 2003, 21, 147–177. [Google Scholar]
  89. Cohen, J. Statistical Power Analysis for the Behavioral Sciences; Academic Press: San Francisco, USA, 1977; ISBN 0-8058-0283-5. [Google Scholar]
  90. Sarlin, P. Exploiting the self-organizing financial stability map. Eng. Appl. Artif. Intell. 2013, 26, 1532–1539. [Google Scholar] [CrossRef]
  91. Hair, J.F., Jr.; Black, W.C.; Babin, B.J.; Anderson, R.E. Multivariate Data Analysis, 7th ed.; Prentice Hall: Upper Saddle River, NJ, USA, 2009; ISBN 9780138132637. [Google Scholar]
  92. Zevi, B. Saper Vedere L’città. Ferrara di Biagio Rossetti, la Prima Città Moderna Europea; Giulio Einaudi Editore: Torino, Italy, 1997. [Google Scholar]
Figure 1. Representation of the 117 urban fabrics of the study [29,30], obtained through Self-Organizing Maps (SOM). The code of each urban fabric is identified in red font. According to the SOM criterion, the urban fabrics that present a greater proximity in the map present a greater global similarity in their features. It is delimited and annotated in a font of text greater in number of profiles to which the studied fabrics belong. Source: Compiled by the authors.
Sustainability 11 06622 g001
Figure 2. Graphical representation of the best number of cluster evaluation. Different criteria are shown: (a) Maximum; (b) Maximal difference; (c) Minimum; (d) Minimal difference. Source: Compiled by the authors.
Sustainability 11 06622 g002
Figure 3. Synthesis of the density metrics of each of the 12 neighborhood profiles obtained. It shows the Effect Size (ES) that each variable has in the constitution of each profile. The ES is indicated both qualitatively and quantitatively, marked in bold type and with thick black squares when the influence is statistically significant (according to Table 1). The colors intuitively show the ES measurement. Aerial photographs of one of the representative urban fabrics contained in each profile are shown. Source compiled by the authors using images from Bing Maps.
Sustainability 11 06622 g003
Figure 4. Aerial photographs and floor plans of the following urban fabrics are shown: (a,b) [112] Bijlmer Oud (Amsterdam); (c,d) [146] Niew Sloten (Amsterdam); and (e,f) [135] Java Island (Amsterdam). Source Compiled by the authors using images from Bing Maps and reworked plans based on [29].
Sustainability 11 06622 g004
Figure 5. Aerial photographs and floor plans of the following fabrics are shown: (a,b) [161] Venserpolder, (c,d) [168] Watergraafsmeer 2, (e,f) [116] Colijnspaat, and (g,h) [145] Niewpoort. Source: Compiled by the authors using images from Bing Maps and Google Maps reworked plans based on [29].
Sustainability 11 06622 g005aSustainability 11 06622 g005b
Figure 6. Representation of the 117 urban fabrics of the study [29,30] obtained through Self-Organizing Maps (SOM). It is the same representation of Figure 1 but indicates these urban fabrics: [161] Venserpolder, [168] Watergraafsmeer 2, [116] Colijnspaat, and [145] Niewpoort. Source: Compiled by the authors.
Sustainability 11 06622 g006
Figure 7. Representation of the 117 urban fabrics of the study [29,30] obtained through self-organizing maps (SOM). It is the same representation of Figure 1 but indicates these urban fabrics: [127] Grachtengordel (Amsterdam), [306] Eixample (Barcelona) y [204] Hackesche Höpe (Berlin). Source: Compiled by the authors.
Sustainability 11 06622 g007
Table 1. Key metrics of profile 2 density compared to total population. Abbreviations: units: urban fabrics; M: Mean; SD: Standard Deviation; Conf.: Confidence (p-value: ns: p > 0.05; *: p ≤ 0.05; ** p ≤ 0.01; ***: p ≤ 0.001; ns: Non-significant); T: two-sided T-test; ES: Size of Effect (+++: Large positive; ++: Medium positive; +: Small positive; - - -: Large negative; - -: Medium negative; -: Small negative). Source: Compiled by the authors.
MeasurementsPopulationProfile 2
117 Units. (100%)20 Units. (17.09%)
MSDMSDConf.TESES
Island-A6.0635.27711.1294.828***4.3270.960+++
Island-FSI1.5401.2610.5220.275***15.228−0.807- - -
Island-GSI0.3840.2230.1880.059***13.808−0.883- - -
Island-OSR1.3752.7632.2081.576*2.1770.301+
Island-L3.8002.1972.7561.152**3.733−0.475-
Fabric-A8.0866.14813.795.969**3.9380.927+++
Fabric-FSI1.0560.8520.4280.245***10.573−0.737- -
Fabric-GSI0.2670.1520.1520.048***9.974−0.754- -
Fabric-OSR1.7922.9192.8612.025*2.1780.366+
Fabric-L3.8002.1972.7561.152**3.732−0.475-
Fabric-N0.0190.0100.0120.003***8.988−0.680- -
Fabric-w141.89092.800183.18062.280*2.7330.445+
Fabric-b17.8038.87717.2943.331ns0.630−0.057
Fabric-T26.96612.23419.2355.562***5.730−0.632- -
Table 2. Comparative table of Fabric-FSI and Fabric-GSI of the fabrics [112] Bijlmer Oud, [146] Niew Sloten, and [135] Java Island of Amsterdam. Data source: [29,30].
Sample of Urban Fabric (City)Floor to Area Ratio (FSI)Ground Space Index (GSI)Profile (Pattern)
Units: m2/m2Units: m2/m2
[112] Bijlmer Oud (Amsterdam)0.760.101 (A)
[146] Niew Sloten (Amsterdam)0.770.335 (B)
[135] Java Island (Amsterdam)2.090.343 (B)
Table 3. Comparative table of Fabric-FSI, Fabric-GSI, and N of [161] Venserpolder (Amsterdam), [168] Watergraafsmeer 2 (Amsterdam), [116] Colijnspaat (Noor-Beveland), and [145] Niewpoort (Liesveld). Data source: [29,30].
Sample of Urban Fabric (City)Floor Area RatioGround Space IndexNetwork DensityProposed Profile (Pattern)
FSI (Perc.) Z-ScoreGSI (Perc.) Z-ScoreN (Perc.) Z-Score
[161] Venserpolder (Amsterdam)1.17 (64.6) 0.1340.26 (56.8) −0.0430.016 (43.1) −0.2644 (B)
[168] Watergraafsmeer 2 (Amsterdam)0.59 (36.2) −0.5570.24 (51.7) −0.1750.021 (66.3) 0.2564 (B)
[116] Colijnsplaat (Noord-Beveland)0.58 (34.4) −0.5680.30 (63.7) 0.2190.022 (72.4) 0.3605 (B)
[145] Nieuwpoort (Liesveld)0.67 (38.7) −0.4530.36 (78.4) 0.6130.020 (57.7) 0.1525 (B)
Mean1.06 (60.2) 00.27 (59.2) 00.019 (54.3) 0-
Standard Deviation0.85 (-) -0.15 (-) -0.010 (-) --

