Viscovery Blog
Welcome to the Viscovery blog! Here you can find everything about our latest news, articles, projects, and use cases.
Welcome to the Viscovery blog! Here you can find everything about our latest news, articles, projects, and use cases.
In a world flooded with data, discerning meaningful patterns from clickstream data is akin to finding a needle in a haystack. Traditional analytics offer a superficial glance at user behaviour but fail to capture the interactions that define the digital experience. Targeted optimization of the website requires understanding the interests and wishes of the users. More...
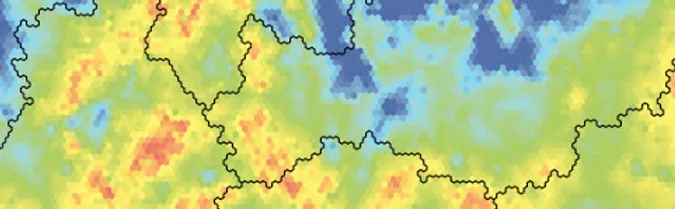
Visualizing Big Data has always been a challenge for data scientists and analysts. In one of our past projects, we demonstrated how even large datasets can be analyzed quickly and efficiently by focusing on smaller samples.
The Dataset
More...
[News Viscovery]
Munich (DE) / Melbourne (AU) / Vienna (AT), 6 February 2023
Together with Nicolas Rost and his colleagues from the Max Planck Institute of Psychiatry, we published the article Multimodal predictions of treatment outcome in major depression: A comparison of data-driven predictors with importance ratings by clinicians in the Journal of Affective Disorders.
More...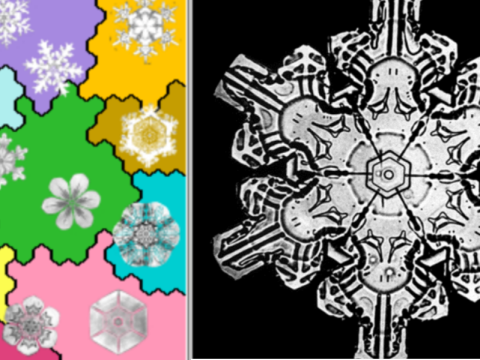
Christmas is just around the corner. The days are short, the nights are even longer. And with a bit of luck, there will even be snow. The crystals that slowly trickle from the sky and cover everything with a white dress only look the same at first glance.
More...
[News Viscovery]
Vienna (AT), 13 December 2022
Data mining specialist Viscovery has released the latest Viscovery® software suite designed to help customers uncover high-value insights in complex data sets. Viscovery SOMine 8 provides new algorithms, an enhanced tool palette of analytical features, numerous usability enhancements and increased performance.
More...
[News Viscovery]
Vienna / Austria, 11 August 2022 Back to work / Back to school offer: -25% Vacation time is slowly ending. But maybe we can sweeten your start into a new work year.
Viscovery is pleased to offer a one-time 25% discount on all Viscovery SOMine 7 licenses for orders until August 31st, 2022.
More...
[News Viscovery]
Munich (DE) / Vienna (AT), 7 June 2022 Viscovery and Biomax are introducing an analysis pipeline for longitudinal brain morphometry studies
More...
[News Viscovery]
Horn (NL) / Vienna (AT), 21 February 2022 Viscovery profiles outcomes to bronchodilator therapy
More...