Local SOM prediction
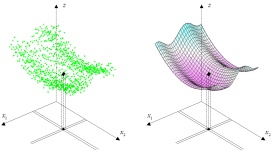
The patented Viscovery prediction technology combines non-linear self-organizing map (SOM) technology with conventional linear statistics (e.g., regression analysis, principal components analysis, correlation matrices and scatter plots). Data are sorted according to overall similarity using SOM technology, and subsequently subdivided into groups that contain only very similar objects. The behavior of these homogenous groups can be predicted far more precisely than using just one group for the entire, inhomogeneous data set.
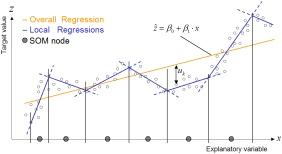
Local regressions are used within the clusters of data, thereby improving the prediction quality considerably compared to conventional prediction methods. The set of local regressions provides a validated prediction model which finally can be applied to new data records to predict target values or to score the data records according to their estimated values. The predicted values can be used immediately in applications or can be subsequently entered into a more comprehensive segmentation model.
Various graphical views (histograms, gains charts, and score charts) and other relevant statistical values (e.g., estimated prediction error) can be displayed. By automatically splitting data into training and test data sets and testing each trained model, optimal support is available for the validation of the models. Different model variants can easily be compared with one another.
Learn more about features and benefits of, and solutions using, Viscovery software.