Viscovery AI Alliance Blog
Welcome to the Viscovery AI Alliance blog!
Here you can find everything about our latest news, articles, projects, and use cases.
Welcome to the Viscovery AI Alliance blog!
Here you can find everything about our latest news, articles, projects, and use cases.

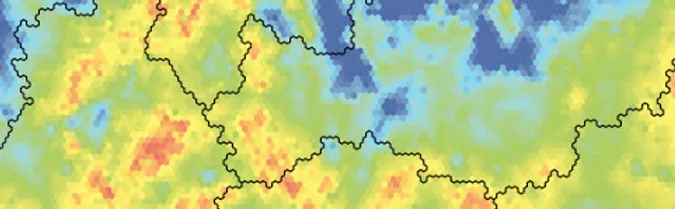
As every year, the Predictive Analytics Conference took place in Vienna in 2024. Over a period of two days, leading data analysts from academic research and business came together to share their knowledge on the topic of predictive analytics in exciting presentations. This year, our colleague, Swetlana Gaffron, also had the opportunity to speak at the conference.
More...
[News Viscovery]
Linz (AT), 17 October 2024
Data mining specialist Viscovery has released the latest version of its Viscovery® SOMine® software suite designed to help customers uncover high-value insights from complex data sets and make accurate and comprehensible predictions.
More...
[News Viscovery]
Linz (AT), 19 August 2024
We are proud to announce Viscovery's 30th anniversary. We are pleased that we have been able to build many great customer relationships over this long period of time, and to continuously improve our software thanks to the expertise of our employees and always with an eye on the needs of our international customers from all areas.
More...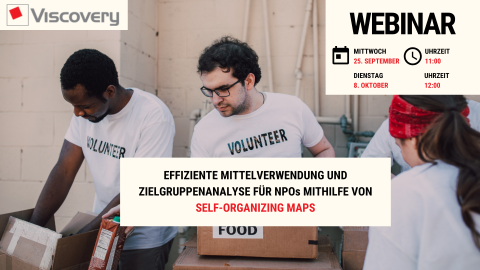
[News Viscovery]
Duisburg (DE) / Munich (DE) / Linz (AT), 27 August 2024
In September and October, Viscovery offers a free webinar (in german language) in which we discuss the uses of self-organizing maps for target group analysis in fundraising of NPOs.
More...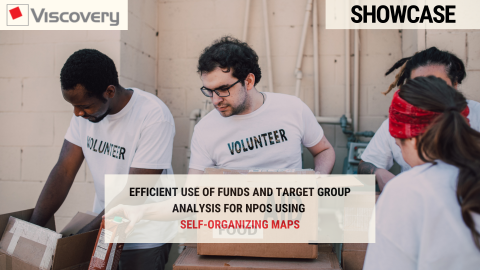
For charitable organisations that rely on donations, it is essential to use their funds efficiently and target donors. Understanding donor behaviour plays a key role in this - from the amount and frequency of donations to preferred donation purposes and payment methods. More...

Data show that on the one hand, the relationship between the African continent and Western countries is getting worse. On the other hand, Russia and China increase their relations with Africa by providing them with digital and technical infrastructure and using their military and economic predominance. But could these data have been a fundamental part of solving the slacking relationship between Western and African countries?
More...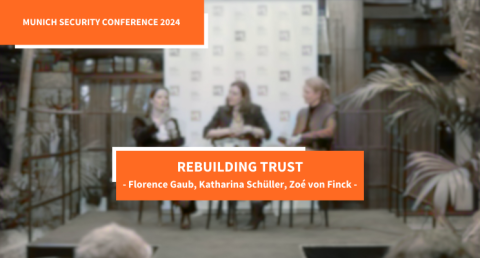
‘Trust is a statement about the future. That's why so many people trust ex-President Trump, he's authentic. In times of constant communication, it is impossible to constantly pretend. The model of the rational, emotionless bureaucrat has had its day and is no longer convincing,’ says futurologist Dr Florence Gaub.
More...
Discover Your Music Style with Data
Have you ever wondered if your hobbies and social background can predict your taste in music? In a recent project, we explored just that! By analyzing data from a large dating service, we created a tool that uses demographic and hobby data to predict music preferences. Here’s how we did it.
The Dataset
More...